10.3 Tools and Techniques
|
Previous
10.2 Identities
|
Next
10.4 The fundamental counting principle
|
10.3 Tools and Techniques (EMCJY)
Venn diagrams are used to show how events are related to one another. A Venn diagram can be very helpful when doing calculations with probabilities. In a Venn diagram each event is represented by a shape, often a circle or a rectangle. The region inside the shape represents the outcomes included in the event and the region outside the shape represents the outcomes that are not in the event.
Tree diagrams are useful for organising and visualising the different possible outcomes of a sequence of events. Each branch in the tree shows an outcome of an event, along with the probability of that outcome. For each possible outcome of the first event, we draw a line where we write down the probability of that outcome and the state of the world if that outcome happened. Then, for each possible outcome of the second event we do the same thing. The probability of a sequence of outcomes is calculated as the product of the probabilities along the branches of the sequence.
Two-way contingency tables are a tool for keeping a record of the counts or percentages in a probability problem. Two-way contingency tables are especially helpful for figuring out whether events are dependent or independent.
Worked example 7: Venn diagrams
There are 200 boys in Grade 12 at Marist Brothers High School. Their participation in sport can be broken down as follows:
- 107 play rugby
- 90 play soccer
- 63 play cricket
- 35 play rugby and soccer
- 23 play rugby and cricket
- 15 play rugby, soccer and cricket
- 190 boys play rugby, soccer or cricket
- How many boys do not play any of these sports?
- Draw a Venn diagram to illustrate the given information and use it to answer the following questions:
- How many boys play soccer and cricket, but not rugby?
- What is the probability that a randomly chosen Grade 12 boy at Marist Brothers High School will take part in at least two of the sports: rugby, soccer or cricket? Give your answer correct to 3 decimal places.
Calculate the number of boys playing none of the given sports
In order to calculate the number of boys playing none of the sports, we subtract the number of boys playing any of the three sports from the total number of boys in the sample space.
\[\text{Not rugby, cricket or soccer } = 200 - 190 = 10\]Therefore \(\text{10}\) boys do not play rugby, cricket or soccer.
Draw the outline of the Venn diagram
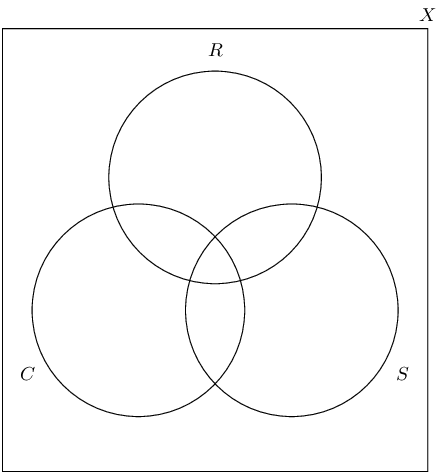
Let \(X =\) the sample space; \(R =\) rugby; \(S =\) soccer and \(C =\) cricket. Put this information on a Venn diagram:
Calculate the counts for the different groupings
The following groupings exist:
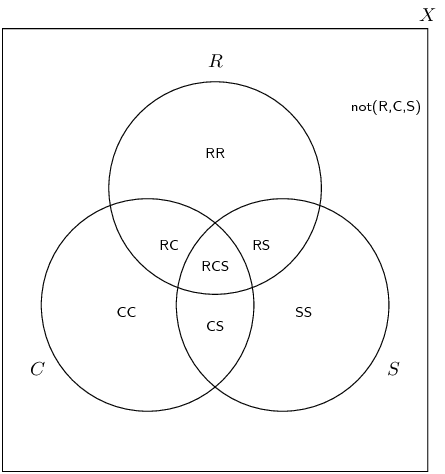
Rugby, cricket and soccer: \(RCS\)
\[RCS = 15\]Rugby and soccer but not cricket: \(RS\)
\begin{align*} RS &= (R \text{ and } S) - RCS\\ &= 35 - 15 = 20 \end{align*}Rugby and cricket but not soccer: \(RC\)
\begin{align*} RC &= (R \text{ and } C) - RCS \\ &= 23 - 15 = 8 \end{align*}Cricket and soccer but not rugby: \(CS\)
\begin{align*} CS &= (S \text{ and } C) - RCS \\ \text{Let } (S \text{ and } C)& = x \\ \text{Therefore } CS &= x - 15 \end{align*}Only rugby: \(RR\)
\begin{align*} RR &= R - RS - RC - RCS \\ &= 107 - 20 - 8 - 15 = 64 \end{align*}Only soccer: \(SS\)
\begin{align*} SS &= S - RS - CS - RCS \\ &= 90 - 20 - (x - 15) - 15 = 70 - x \end{align*}Only cricket: \(CC\)
\begin{align*} CC &= C - RC - CS - RCS \\ &= 63 - 8 - (x - 15) - 15 = 55 - x \end{align*}Not rugby, cricket or soccer: \(\text{not}(R,C,S)\)
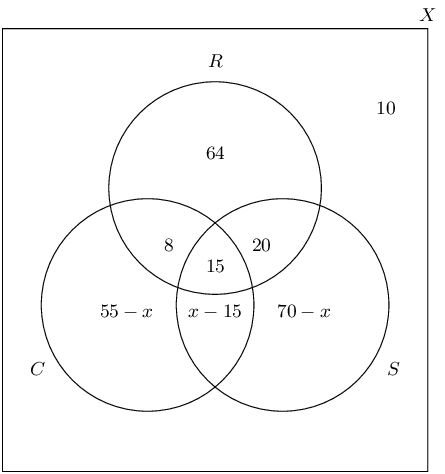
\[\text{not}(R,C,S) = 10\]Fill in the counts on the Venn diagram
Calculate the unknown values
Since 190 of the boys play at least one of the sports, using the values on our Venn diagram, we can set up the following equation to solve for \(x\).
\begin{align*} 64 + 8 + 15 + 20 + (x - 15) + (70 - x) + (55 - x) &= 190 \\ 217 - x &= 190 \\ \text{Therefore } x &= 27 \end{align*}We know that:
\begin{align*} \text{Cricket and soccer but not rugby } (CS) & = x - 15 \\ \text{Therefore } CS &= 27 - 15 \\ &= 12 \end{align*}Therefore there are 12 boys who play cricket and soccer but not rugby.
Calculate the probability that a randomly chosen Grade 12 boy plays at least two of the given sports
We know the number of boys who play two or more of rugby, cricket or soccer and we know the total number of boys. Therefore, we can calculate the probability using the following equation:
\begin{align*} P(\text{at least two sports}) &= \dfrac{n(RC)+n(RS)+n(CS)+n(RCS)}{n(X)} \\ &= \dfrac{8+15+20+12}{200} \\ &= \frac{55}{200} = \text{0,275} \end{align*}Therefore the probability that a randomly chosen Grade 12 boy plays at least 2 of either rugby, cricket or soccer \(= \text{0,275}\) or \(\text{27,5}\%\)
Worked example 8: Tree diagrams
The probability that the floor of a supermarket will be wet when it opens in the morning is \(\text{30}\%\) and there is a \(\text{10}\%\) probability of the floor being very wet. The probability that a person will slip and fall if the floor is dry is \(\text{12}\%\) and a person is three times as likely to fall if the floor is wet. If the floor is very wet, the probability that a person will fall is \(\text{0,6}\). Draw a tree diagram to represent the given information, showing the probabilities of each outcome, and use it to answer the following questions:
- What is the probability that a person will fall on any given day?
- What is the probability that a person will not fall on any given day?
- Are the events of the floor being dry and a person falling independent? Justify your answer with a calculation.
Identify the events
There are three outcomes for the floor, namely, dry, wet and very wet, and two outcomes for a person, namely fall or not fall.
Draw the first level of the tree diagram
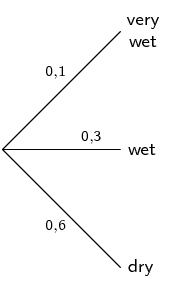
This tree diagram shows the possible outcomes and probabilities of the status of the floor.
Draw the second level of the tree diagram
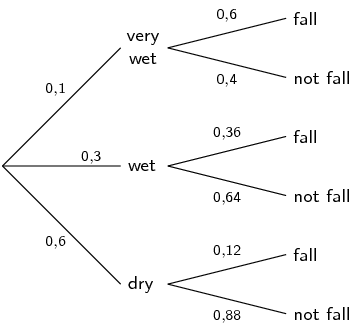
This tree diagram shows the possible outcomes and probabilities based on whether the floor is very wet, wet or dry. Remember that the sum of the probabilities for any set of branches is 1. Use this as a logical check whenever you are constructing a tree diagram.
Compute the probabilities of the various outcomes
We can calculate the probability of each outcome by multiplying the probabilities along the path from the start of the tree to the end of the branch containing the desired outcome.
- \(P(\text{very wet and fall}) = \text{0,1} \times \text{0,6} = \text{0,06}\)
- \(P(\text{very wet and not fall}) = \text{0,1} \times \text{0,4} = \text{0,04}\)
- \(P(\text{wet and fall}) = \text{0,3} \times \text{0,36} = \text{0,108}\)
- \(P(\text{wet and not fall}) = \text{0,3} \times \text{0,64} = \text{0,192}\)
- \(P(\text{dry and fall}) = \text{0,6} \times \text{0,12} = \text{0,072}\)
- \(P(\text{dry and not fall}) = \text{0,6} \times \text{0,88} = \text{0,528}\)
Compute the probability of falling or not falling
We can calculate the probability of falling or not falling by adding the probabilities of all the desired outcomes.
- \(P(\text{fall}) = \text{0,06} + \text{0,108} + \text{0,072} = \text{0,24}\)
- \(P(\text{not fall}) = \text{0,04} + \text{0,192} + \text{0,528} = \text{0,76}\)
Therefore the probability of falling on a given day is \(\text{24}\%\) and the probability of not falling is \(\text{76}\%\).
Determine whether the floor being dry and a person falling are independent events
Logically, it appears that these events are dependent but the question asked us to prove this using a calculation. We can do this using the rule for independent events:
\[P(A \text{ and } B) = P(A) \times P(B)\] \begin{align*} P(\text{dry and fall}) &= \text{0,072} \\ P(\text{dry}) \times P(\text{fall}) &= \text{0,6} \times \text{0,24} \\ &= \text{0,144} \\ \text{Therefore } P(\text{dry and fall})& \ne P(\text{dry}) \times P(\text{fall}) \end{align*}Therefore we can conclude that the floor being dry and a person falling are dependent events.
Venn and tree diagrams
A survey was done on a group of learners to determine which type of TV shows they enjoy: action, comedy or drama. Let \(A =\) action, \(C =\) comedy and \(D =\) drama. The results of the survey are shown in the Venn diagram below.
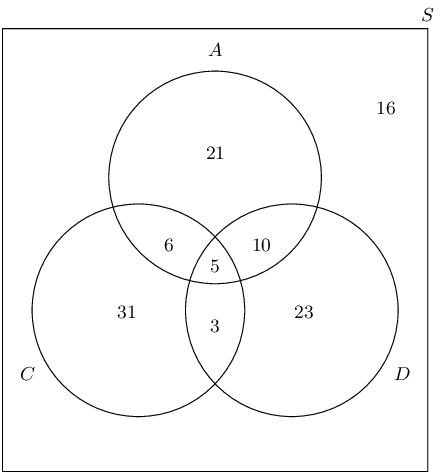
Study the Venn diagram and determine the following:
\(P(\text{not }A)\): the probability that learners do not enjoy action TV shows
\(P(A \text{ or } D)\): the probability that learners enjoy action or drama TV shows
\(P(A \text{ and } D \text{ and } C)\): the probability that learners enjoy action, drama and comedy TV shows
\(P(\text{not } (A \text{ and } D))\): the probability that learners do not enjoy action and drama TV shows
\(P(A \text{ or not }C)\): the probability that learners enjoy action TV shows or do not enjoy comedy TV shows
\(P(\text{not }(A \text{or }C))\): the probability that learners do not enjoy action or comedy TV shows
At Thandokulu Secondary School, there are are \(\text{320}\) learners in Grade 12, 270 of whom take one or more of Mathematics, History and Economics. The subject choice is such that everybody who takes Physical Sciences must also take Mathematics and nobody who takes Physical Sciences can take History or Economics. The following is known about the number of learners who take these subjects:
- 70 take History
- 50 take Economics
- 120 take Physical Sciences
- 200 take Mathematics
- 20 take Mathematics and History
- 10 take History and Economics
- 25 take Mathematics and Economics
- \(x\) learners take Mathematics and History and Economics
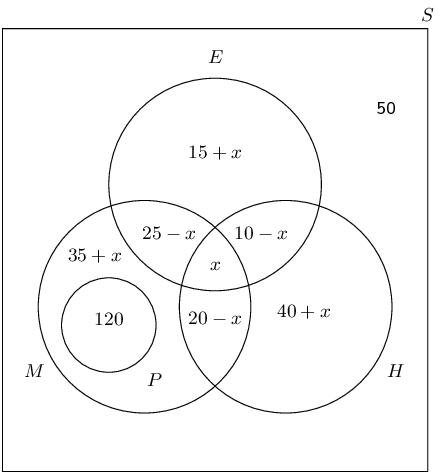
Therefore \(\text{5}\) learners take Mathematics, History and Economics.
This is the probability that a learner does not take Mathematics, History or Economics.
This question requires us to find the sum of the probabilities of all the learners who take at least two subjects. This includes the intersection of each of the subjects.
\begin{align*} P(\text{at least two subjects}) &= \dfrac{120 + 20 + 5 + 5 + 15}{320} \\ & = \frac{33}{64} \end{align*}A group of \(\text{200}\) people were asked about the kind of sports they watch on television. The information collected is given below:
- \(\text{180}\) watch rugby, cricket or soccer
- \(\text{5}\) watch rugby, cricket and soccer
- \(\text{25}\) watch rugby and cricket
- \(\text{30}\) watch rugby and soccer
- \(\text{100}\) watch rugby
- \(\text{65}\) watch cricket
- \(\text{80}\) watch soccer
- \(x\) watch cricket and soccer but not rugby
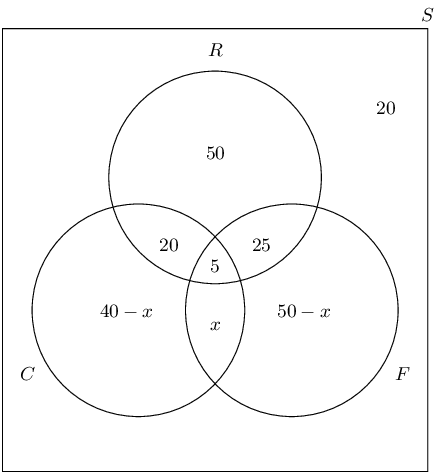
Therefore watching rugby and watching cricket are dependent events.
There are \(\text{25}\) boys and \(\text{15}\) girls in the English class. Each lesson, two learners are randomly chosen to do an oral.
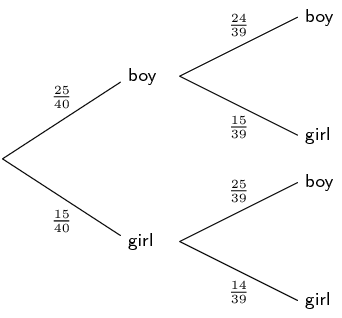
Note: This question can be answered by subtracting the outcome not containing a boy (girl; girl) from 1 (shown below) or by adding the three outcomes which include a boy. Either method is correct.
\begin{align*} 1 - \left(\frac{15}{40} \times \frac{14}{39}\right)&=1 - \frac{7}{52} \\ &= \frac{45}{52} \end{align*}Therefore picking a boy first and picking a girl second are dependent events.
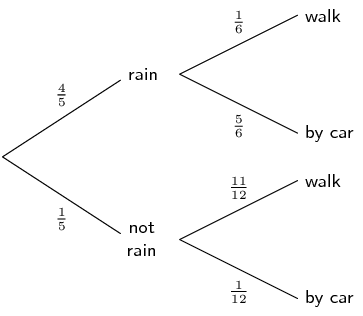
During July in Cape Town, the probability that it will rain on a randomly chosen day is \(\frac{4}{5}\). Gladys either walks to school or gets a ride with her parents in their car. If it rains, the probability that Gladys’ parents will take her to school by car is \(\frac{5}{6}\). If it does not rain, the probability that Gladys' parents will take her to school by car is \(\frac{1}{12}.\)
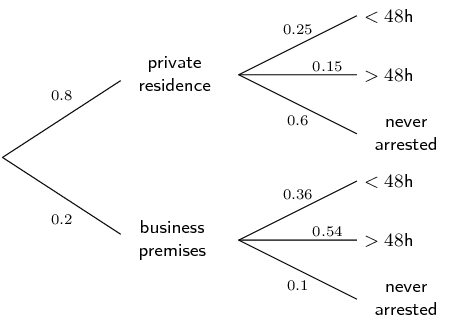
There are two types of property burglaries: burglary of private residences and burglary of business premises. In Metropolis, burglary of a private residence is four times as likely as that of a business premises. The following statistics for each type of burglary were obtained from the Metropolis Police Department:
Burglary of private residences
Following a burglary:
- \(\text{25}\%\) of criminals are arrested within \(\text{48}\) \(\text{hours}\).
- \(\text{15}\%\) of criminals are arrested after \(\text{48}\) \(\text{hours}\).
- \(\text{60}\%\) of criminals are never arrested for that particular burglary.
Burglary of business premises
Following a burglary:
- \(\text{36}\%\) of criminals are arrested within \(\text{48}\) \(\text{hours}\).
- \(\text{54}\%\) of criminals are arrested after \(\text{48}\) \(\text{hours}\).
- \(\text{10}\%\) of criminals are never arrested for that particular burglary.
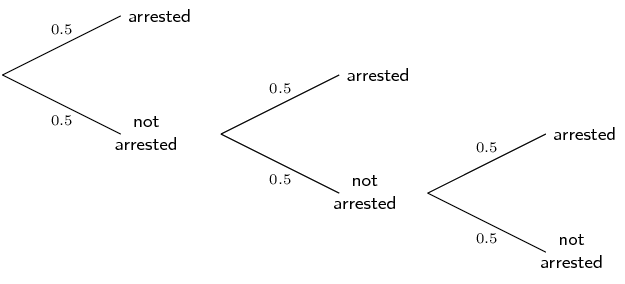
This answer could also be reached by subtracting the probability of not being arrested after three burglaries from 1:
\[1 - (\text{0,5} \times \text{0,5} \times \text{0,5}) = 1 - \text{0,5}^{3} = 1 - \text{0,125} = \text{0,875}\]We will use this principle to answer the next question.
- \(\text{90}\%\) chance of being arrested.
- \(\text{99}\%\) chance of being arrested.
Let the number of burglaries \(= n\)
- \begin{align*}
\text{0,90}&= 1 - P(\text{not arrested})^{n} \\
&= 1 - \text{0,5}^{n}\\
\text{Therefore } \text{0,1} &= \text{0,5}^{n} \\
\text{Therefore } n &= \log_{\text{0,5}}{\text{0,1}} \\
&= \text{3,32}
\end{align*}
After \(\text{4}\) burglaries, there will be at least a \(\text{90}\%\) chance of being arrested.
- \begin{align*}
\text{0,99}&= 1 - P(\text{not arrested})^{n} \\
&= 1 - \text{0,5}^{n}\\
\text{Therefore } \text{0,01} &= \text{0,5}^{n} \\
\text{Therefore } n &= \log_{\text{0,5}}{\text{0,01}} \\
&= \text{6,64}
\end{align*}
After \(\text{7}\) burglaries, there will be at least a \(\text{99}\%\) chance of being arrested.
Worked example 9: Two-way contingency tables
The table below shows the results of testing two different treatments on 240 fruit trees which have a disease causing the trees to die. Treatment \(A\) involves the careful removal of infected branches and treatment \(B\) involves removing infected branches as well as spraying the tree with antibiotic.
| Tree dies within 4 years | Tree lives \(>\) 4 years | Total | |
| Treatment A | \(\text{70}\) | \(\text{50}\) | |
| Treatment B | |||
| Total | \(\text{90}\) | \(\text{150}\) |
- Fill in the missing values on the table.
- What is the probability the a tree received treatment B?
- What is the probability that a tree will live beyond 4 years?
- What is the probability that a tree is given treatment B and lives beyond 4 years?
- Of the trees who were given treatment B, what is the probability that a tree lives beyond 4 years?
- Are a tree given treatment B and living beyond 4 years independent events? Justify your answer with a calculation.
Complete the contingency table
Since each column has to sum to its total, we can work out the number of trees which fall into each category for treatments A and B. Then, we can add each row to get the totals on the right hand side of the table.
| Tree dies within 4 years | Tree lives \(>\) 4 years | Total | |
| Treatment A | \(\text{70}\) | \(\text{50}\) | \(\text{120}\) |
| Treatment B | \(\text{20}\) | \(\text{100}\) | \(\text{120}\) |
| Total | \(\text{90}\) | \(\text{150}\) | \(\text{240}\) |
Compute the required probabilities
For the second question, we need to determine the probability that a tree receives treatment B. This means that we do not include treatment A in this calculation. So, the probability that treatment B is given to a tree is the ratio between the number of trees that received treatment B and the total number of trees.
\begin{align*} P(\text{treatment B}) &= \dfrac{n(\text{treatment B})}{n(\text{total trees})} \\ &= \frac{\text{120}}{\text{240}} \\ &= \frac{1}{2} \end{align*}Similarly for the third question, the probability that a tree will live beyond \(\text{4}\) years:
\begin{align*} P(\text{lives beyond }4 \text{ years}) &= \dfrac{n(\text{lives } > \text{4} \text{ years})}{n(\text{total trees})} \\ &= \frac{\text{150}}{\text{240}} \\ &= \frac{5}{8} \end{align*}In the fourth question, we need to determine the probability that a tree receives treatment B and lives beyond \(\text{4}\) years.
\begin{align*} P(\text{treatment B and lives } > \text{4} \text{ years}) &= \dfrac{n(\text{treatment B and lives } > \text{4} \text{ years})}{n(\text{total trees})} \\ &= \frac{\text{100}}{\text{240}} \\ &= \frac{5}{12} \end{align*}In the fifth question, there is a subtle change from the fourth question. Here, we need to determine the probability that of the trees which received treatment B, a tree lives beyond \(\text{4}\) years. This means we are only concerned with those trees which received treatment B. We no longer need to care about the trees given treatment A, so our denominator needs to be adjusted accordingly.
\begin{align*} P(\text{lives } > \text{4} \text{ years having received treatment B}) &= \dfrac{n(\text{treatment B and lives } > \text{4} \text{ years})}{n(\text{total treatment B})} \\ &= \frac{\text{100}}{\text{120}} \\ &= \frac{5}{6} \end{align*}Independence
We need to determine whether a tree given treatment B and living beyond \(\text{4}\) years are dependent or independent events. According to the definition, two events are independent if and only if \[P(A\text{ and }B) = P(A) \times P(B)\]
\begin{align*} P(\text{treatment B}) \times P(\text{lives } > \text{4} \text{ years}) &= \frac{1}{2} \times \frac{5}{8} \\ &= \frac{5}{16} \end{align*}\[P(\text{treatment B and lives } > \text{4} \text{ years})= \frac{5}{12}\]From these probabilities we can see that \[P(\text{treatment B and lives } >\text{4} \text{ years}) \ne P(\text{treatment B}) \times P(\text{lives } > \text{4} \text{ years})\] and therefore the treatment of a tree with treatment B and living beyond \(\text{4}\) years are dependent events.
Contingency tables
A number of drivers were asked about the number of motor vehicle accidents they were involved in over the last 10 years. Part of the data collected is shown in the table below.
| \(\leq\) 2 accidents | \(>\) 2 accidents | Total | |
| Female | \(\text{210}\) | \(\text{90}\) | |
| Male | |||
| Total | \(\text{350}\) | \(\text{150}\) | \(\text{500}\) |
What are the variables investigated here and what is the purpose of the research?
The variables are gender and number of accidents over a period of 10 years. The purpose of the research is to determine if gender is related to the number of accidents a driver is involved in.
| \(\leq\) 2 accidents | \(>\) 2 accidents | Total | |
| Female | \(\text{210}\) | \(\text{90}\) | \(\text{300}\) |
| Male | \(\text{140}\) | \(\text{60}\) | \(\text{200}\) |
| Total | \(\text{350}\) | \(\text{150}\) | \(\text{500}\) |
It can be seen that in all cases \(P(A) \times P(B) = P(A \text{ and } B)\), therefore number of motor vehicle accidents is independent of the gender of the driver.
Researchers conducted a study to test how effective a certain inoculation is at preventing malaria. Part of their data is shown below:
| Malaria | No malaria | Total | |
| Male | \(a\) | \(b\) | \(\text{216}\) |
| Female | \(c\) | \(d\) | \(\text{648}\) |
| Total | \(\text{108}\) | \(\text{756}\) | \(\text{864}\) |
Calculate the probability that a randomly selected study participant will be female.
Calculate the probability that a randomly selected study participant will have malaria.
If being female and having malaria are independent events, calculate the value \(c\).
Using the value of \(c\), fill in the missing values on the table.
| Malaria | No malaria | Total | |
| Male | 27 | 189 | \(\text{216}\) |
| Female | 81 | 567 | \(\text{648}\) |
| Total | \(\text{108}\) | \(\text{756}\) | \(\text{864}\) |
The reaction time of \(\text{400}\) drivers during an emergency stop was tested. Within the study cohort (the group of people being studied), the probability that a driver chosen at random was \(\text{40}\) years old or younger is \(\text{0,3}\) and the probability of a reaction time less than \(\text{1,5}\) \(\text{seconds}\) is \(\text{0,7}\).
Calculate the number of drivers who are \(\text{40}\) years old or younger.
Calculate the number of drivers who have a reaction time of less than \(\text{1,5}\) \(\text{seconds}\).
If age and reaction time are independent events, calculate the number of drivers \(\text{40}\) years old and younger with a reaction time of less than \(\text{1,5}\) \(\text{seconds}\).
Complete the table below.
| Reaction time \(< \text{1,5}\text{ s}\) | Reaction time \(> \text{1,5}\text{ s}\) | Total | |
| \(\leq\)\(\text{40}\) years | |||
| \(>\) \(\text{40}\) years | |||
| Total | 400 |
| Reaction time \( | Reaction time \(>\) \(\text{1,5}\) \(\text{s}\) | Total | |
| \(\leq\) \(\text{40}\) years | 84 | 36 | 120 |
| \(>\) \(\text{40}\) years | 196 | 84 | 280 |
| Total | 280 | 120 | 400 |
A new treatment for influenza (the flu) was tested on a number of patients to determine if it was better than a placebo (a pill with no therapeutic value). The table below shows the results three days after treatment:
| Flu | No flu | Total | |
| Placebo | \(\text{228}\) | \(\text{60}\) | |
| Treatment | |||
| Total | \(\text{240}\) | \(\text{312}\) |
| Flu | No flu | Total | |
| Placebo | \(\text{228}\) | \(\text{60}\) | \(\text{288}\) |
| Treatment | \(\text{12}\) | \(\text{252}\) | \(\text{264}\) |
| Total | \(\text{240}\) | \(\text{312}\) | \(\text{552}\) |
Therefore receiving treatment and having no flu after three days are dependent events.
The probability of having no influenza after three days is much higher when on the new treatment so its use is recommended.
A hospital is trying to decide whether to purchase the new treatment. The new treatment is much more expensive than the old treatment. According to the hospital records, of the \(\text{72 024}\) flu patients that have been treated with the old treatment, only \(\text{3 200}\) still had the flu three days after treatment.
- Construct a two-way contingency table comparing the old treatment data with the new treatment data.
- Using the data from your table, advise the hospital whether to purchase the new treatment or not.
| Flu | No flu | Total | |
| Old treatment | \(\text{3 200}\) | \(\text{68 824}\) | \(\text{72 024}\) |
| New treatment | \(\text{12}\) | \(\text{252}\) | \(\text{264}\) |
| Total | \(\text{3 212}\) | \(\text{69 076}\) | \(\text{72 288}\) |
The probability of not having flu after three days if given the new treatment is approximately the same if given the old treatment, therefore the hospital should not purchase the new, more expensive treatment.
Human immunodeficiency virus (HIV) affects \(\text{10}\%\) of the South African population.
If \(\text{10 000}\) people are tested and the prevalence rate is \(\text{10}\%\):
\begin{align*} \text{10 000} \times \text{0,1} &= \text{1 000} \text{ people are expected to be sick} \\ \text{Therefore } \text{10 000} - \text{1 000} &= \text{9 000} \text{ people are expected to be healthy} \end{align*}| Sick | Healthy | Total | |
| Positive | |||
| Negative | |||
| Total | \(\text{1 000}\) | \(\text{9 000}\) | \(\text{10 000}\) |
If the test is \(\text{99,9}\%\) accurate:
\begin{align*} \text{1 000} \times \text{0,999} &= \text{999} \text{ sick people are expected to test positive} \\ \text{Therefore } \text{1 000} - \text{999} &= \text{1} \text{ sick person is expected to test negative} \\ \text{And }\text{9 000} \times \text{0,999} &= \text{8 991} \text{ healthy people are expected to test negative} \\ \text{Therefore } \text{9 000} - \text{8 991} &= \text{9} \text{ healthy people are expected to test positive} \end{align*}| Sick | Healthy | Total | |
| Positive | \(\text{999}\) | \(\text{9}\) | \(\text{1 008}\) |
| Negative | \(\text{1}\) | \(\text{8 991}\) | \(\text{8 992}\) |
| Total | \(\text{1 000}\) | \(\text{9 000}\) | \(\text{10 000}\) |
It is worth noting that this probability is bigger than the one suggested by the '\(\text{99,9}\%\) accuracy' of the test.
|
Previous
10.2 Identities
|
Table of Contents |
Next
10.4 The fundamental counting principle
|
