Home Practice
For learners and parents For teachers and schools
Textbooks
Full catalogue
Leaderboards
Learners Leaderboard Classes/Grades Leaderboard Schools Leaderboard
Pricing Support
Help centre Contact us
Log in

We think you are located in United States. Is this correct?

11.5 Symmetric and skewed data

11.5 Symmetric and skewed data (EMBKD)

We are now going to classify data sets into \(\text{3}\) categories that describe the shape of the data distribution: symmetric, left skewed, right skewed. We can use this classification for any data set, but here we will look only at distributions with one peak. Most of the data distributions that you have seen so far have only one peak, so the plots in this section should look familiar.

Distributions with one peak are called unimodal distributions. Unimodal literally means having one mode. (Remember that a mode is a maximum in the distribution.)

Symmetric distributions (EMBKF)

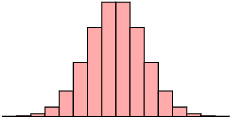
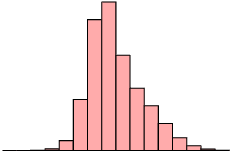
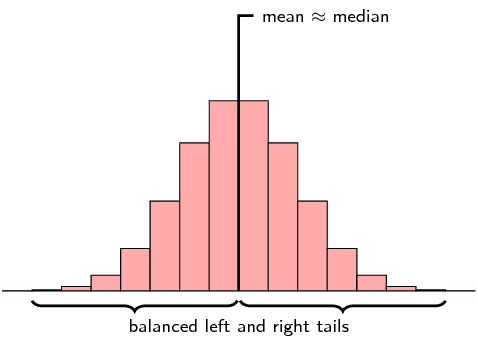
A symmetric distribution is one where the left and right hand sides of the distribution are roughly equally balanced around the mean. The histogram below shows a typical symmetric distribution.

7588d6507c1315bd04332b326df7bec5.png

For symmetric distributions, the mean is approximately equal to the median. The tails of the distribution are the parts to the left and to the right, away from the mean. The tail is the part where the counts in the histogram become smaller. For a symmetric distribution, the left and right tails are equally balanced, meaning that they have about the same length.

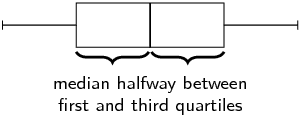
The figure below shows the box and whisker diagram for a typical symmetric data set.

ab60e0f6d55dc2b7d4310e51dc74e6c2.png

Another property of a symmetric distribution is that its median (second quartile) lies in the middle of its first and third quartiles. Note that the whiskers of the plot (the minimum and maximum) do not have to be equally far away from the median. In the next section on outliers, you will see that the minimum and maximum values do not necessarily match the rest of the data distribution well.

Skewed (EMBKG)

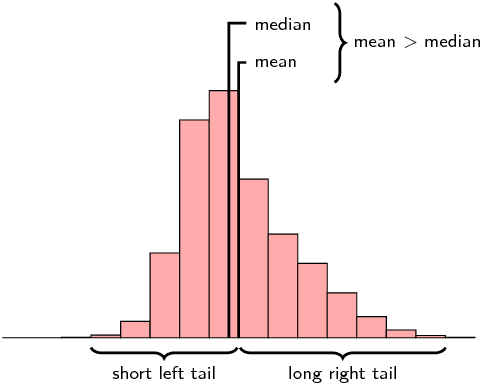
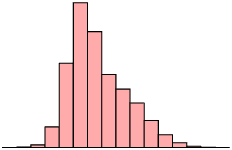
A distribution that is skewed right (also known as positively skewed) is shown below.

690b5a06e1e448c583a88be23f6c747f.png

Now the picture is not symmetric around the mean anymore. For a right skewed distribution, the mean is typically greater than the median. Also notice that the tail of the distribution on the right hand (positive) side is longer than on the left hand side.

444a48f3fe5d1941d61c68b66ccdc00a.png

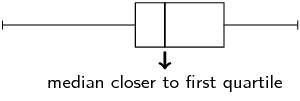
From the box and whisker diagram we can also see that the median is closer to the first quartile than the third quartile. The fact that the right hand side tail of the distribution is longer than the left can also be seen.

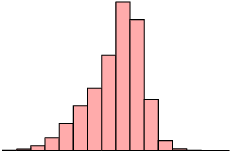
A distribution that is skewed left has exactly the opposite characteristics of one that is skewed right:

  • the mean is typically less than the median;
  • the tail of the distribution is longer on the left hand side than on the right hand side; and
  • the median is closer to the third quartile than to the first quartile.

The table below summarises the different categories visually.

Symmetric Skewed right (positive) Skewed left (negative)
9142251d551fb9f6b96788c51dd673fc.png 16a41118060388794f0236781dba06f0.png 74b10b524855eb38756ba9fb6e38bd46.png
7a68d883266e5d200e34826a84f5ca1d.png 2ac7b43a6cd37116b78db86da8186712.png 535072468cefcca512f0295109148fa0.png

Symmetric and skewed data

Textbook Exercise 11.5

Is the following data set symmetric, skewed right or skewed left? Motivate your answer.

\(\text{27}\) ; \(\text{28}\) ; \(\text{30}\) ; \(\text{32}\) ; \(\text{34}\) ; \(\text{38}\) ; \(\text{41}\) ; \(\text{42}\) ; \(\text{43}\) ; \(\text{44}\) ; \(\text{46}\) ; \(\text{53}\) ; \(\text{56}\) ; \(\text{62}\)

The statistics of the data set are

  • mean: \(\text{41,1}\);
  • first quartile: \(\text{33}\);
  • median: \(\text{41,5}\);
  • third quartile: \(\text{45}\).
We can conclude that the data set is skewed left for two reasons.
  • The mean is less than the median. There is only a very small difference between the mean and median, so this is not a very strong reason.
  • A better reason is that the median is closer to the third quartile than the first quartile.

State whether each of the following data sets are symmetric, skewed right or skewed left.

A data set with this histogram:

1e9012f635d74fa84ee518716e4e089b.png
skewed right

A data set with this box and whisker plot:

7896232b0950311323c260b477bae49b.png
skewed right

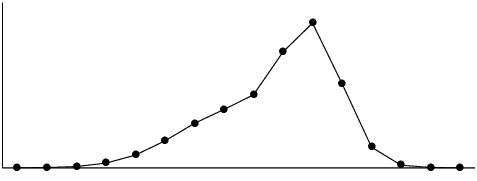
A data set with this frequency polygon:

171e502aca6e472de4c0cd535b2cbc24.png
skewed left

The following data set:

\(\text{11,2}\) ; \(\text{5}\) ; \(\text{9,4}\) ; \(\text{14,9}\) ; \(\text{4,4}\) ; \(\text{18,8}\) ; \(-\text{0,4}\) ; \(\text{10,5}\) ; \(\text{8,3}\) ; \(\text{17,8}\)

The statistics of the data set are

  • mean: \(\text{9,99}\);
  • first quartile: \(\text{6,65}\);
  • median: \(\text{9,95}\);
  • third quartile: \(\text{13,05}\).
Note that we get contradicting indications from the different ways of determining whether the data is skewed right or left.
  • The mean is slightly greater than the median. This would indicate that the data set is skewed right.
  • The median is slightly closer to the third quartile than the first quartile. This would indicate that the data set is skewed left.
Since these differences are so small and since they contradict each other, we conclude that the data set is symmetric.

Two data sets have the same range and interquartile range, but one is skewed right and the other is skewed left. Sketch the box and whisker plot for each of these data sets. Then, invent data (\(\text{6}\) points in each data set) that matches the descriptions of the two data sets.

Learner-dependent answer.