How many students got between \(\text{50}\%\) and
\(\text{70}\%\)?
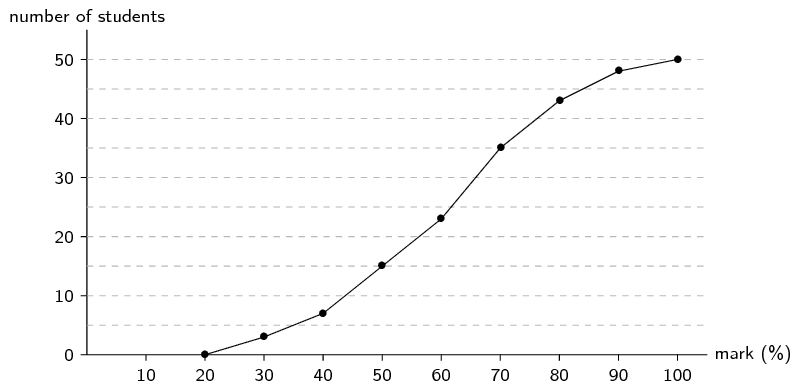
The cumulative plot shows that \(\text{15}\) students got
below \(\text{50}\%\) and \(\text{35}\) students got
below \(\text{70}\%\).
Therefore \(35-15=\text{20}\) students got between
\(\text{50}\%\) and \(\text{70}\%\).
How many students got at least \(\text{70}\%\)?
The cumulative plot shows that \(\text{35}\) students got
below \(\text{70}\%\) and that there are \(\text{50}\)
students in total.
Therefore \(50-35=\text{15}\) students got at least
(greater than or equal to) \(\text{70}\%\).
Compute the average mark for this class, rounded to
the nearest integer.
To compute the average, we first need to use the ogive to
determine the frequency of each interval.
The frequency of an interval is the difference between
the cumulative counts at the top and bottom of the
interval on the ogive.
It might be difficult to read the exact cumulative count
for some of the points on the ogive.
But since the final answer will be rounded to the
nearest integer, small errors in the counts will not
make a difference.
The table below summarises the counts.
| Interval |
\([20,30)\) |
\([30,40)\) |
\([40,50)\) |
\([50,60)\) |
\([60,70)\) |
\([70,80)\) |
\([80,90)\) |
\([90,100)\) |
| Count |
\(\text{3}\) |
\(\text{4}\) |
\(\text{8}\) |
\(\text{8}\) |
\(\text{12}\) |
\(\text{8}\) |
\(\text{5}\) |
\(\text{2}\) |
The average is then the centre of each interval, weighted by
the count in that interval.
\[\frac{3 \times 25 + 4 \times 35 + 8 \times 45 + 8
\times 55 + 12 \times 65 + 8 \times 75 + 5 \times 85 + 2
\times 95}{3+4+8+8+12+8+5+2} = \text{60,2}\]
The average mark, rounded to the nearest integer, is
\(\text{60}\%\).

