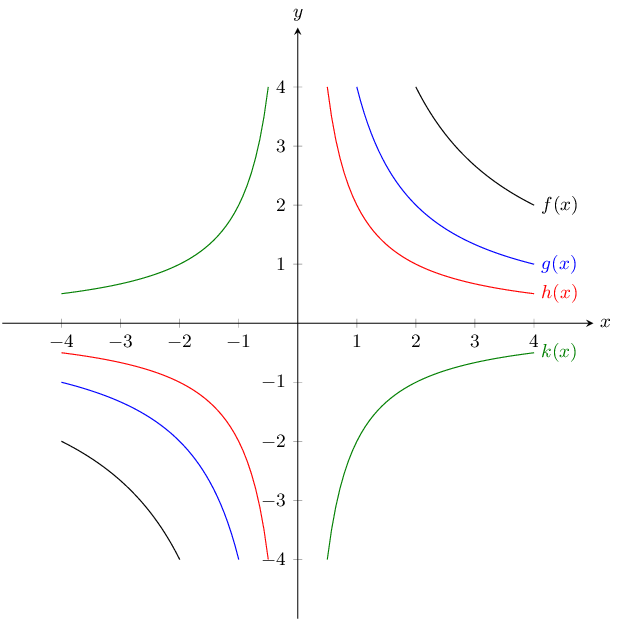
\(y = \dfrac{1}{x}\) and \(\dfrac{3}{x}\)
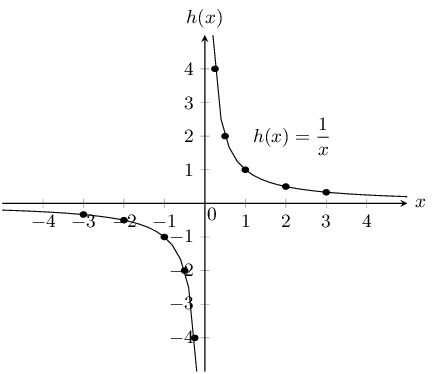
\(a\) is positive for both graphs and so both graphs lie in the first and third quadrants.
For both graphs there is no \(y\)-intercept or \(x\)-intercept.
Instead we can plot the graph from a table of values.
\(y = \frac{1}{x}\):
\[\begin{array}{|c|c|c|c|c|}
\hline
x & -2 & -1 & 1 & 2 \\ \hline
y & -\frac{1}{2} & -1 & 1 & \frac{1}{2} \\
\hline
\end{array}\]
\(y = \frac{3}{x}\):
\[\begin{array}{|c|c|c|c|c|}
\hline
x & -2 & -1 & 1 & 2 \\ \hline
y & -\frac{3}{2} & -3 & 3 & \frac{3}{2} \\
\hline
\end{array}\]
The asymptotes are \(y = 0\) and \(x = 0\).
Now we can plot the graphs:
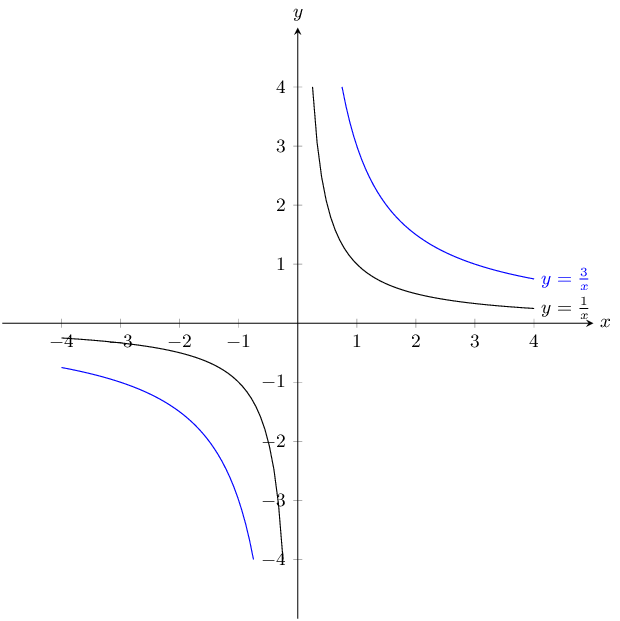
Magnification by 3
\(y = \dfrac{6}{x}\) and \(\dfrac{6}{x} - 1\)
\(a\) is positive for both graphs and so both graphs lie in the first and third quadrants.
For both graphs there is no \(y\)-intercept. For \(y = \frac{6}{x}\) there is no \(x\)-intercept. For
\(y = \frac{6}{x} - 1\) the \(x\)-intercept is \((6;0)\).
We can plot the graphs from a table of values.
\(y = \frac{6}{x}\):
\[\begin{array}{|c|c|c|c|c|}
\hline
x & -2 & -1 & 1 & 2 \\ \hline
y & -3 & -6 & 6 & 3 \\
\hline
\end{array}\]
\(y = \frac{6}{x} - 1\):
\[\begin{array}{|c|c|c|c|c|}
\hline
x & -2 & -1 & 1 & 2 \\ \hline
y & -4 & -7 & 5 & 2 \\
\hline
\end{array}\]
The asymptotes for \(y = \frac{6}{x}\) are \(y = 0\) and \(x = 0\).
The asymptotes for \(y = \frac{6}{x} - 1\) are \(y = -1\) and \(x = 0\).
Now we can plot the graphs:
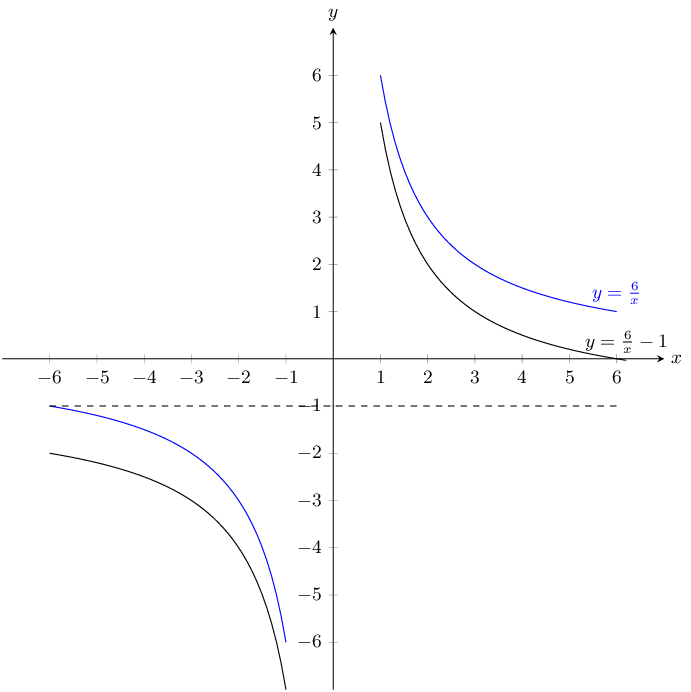
Translation along the \(y\)-axis by -1
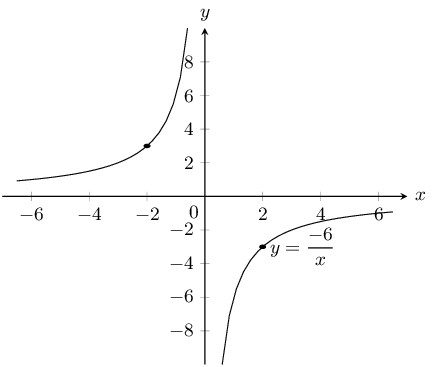
\(y = \dfrac{5}{x}\) and \(-\dfrac{5}{x}\)
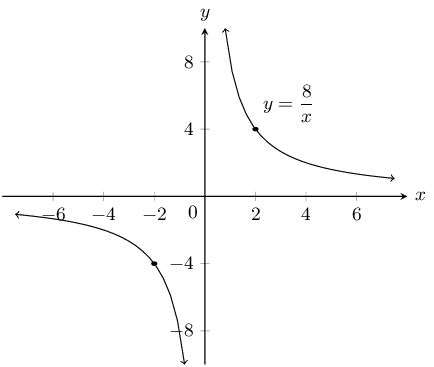
\(y = \frac{5}{x}\):
\(a\) is positive and so the graph lies in the first and third quadrants.
There is no \(y\)-intercept and no \(x\)-intercept.
We can plot the graph from a table of values.
\[\begin{array}{|c|c|c|c|c|}
\hline
x & -2 & -1 & 1 & 2 \\ \hline
y & -\frac{5}{2} & -5 & 5 & \frac{5}{2} \\
\hline
\end{array}\]
The asymptotes are \(y = 0\) and \(x = 0\).
\(y = -\frac{5}{x}\):
\(a\) is negative and so the graph lies in the second and fourth quadrants.
There is no \(y\)-intercept and no \(x\)-intercept.
We can plot the graph from a table of values.
\[\begin{array}{|c|c|c|c|c|}
\hline
x & -2 & -1 & 1 & 2 \\ \hline
y & \frac{5}{2} & 5 & -5 & -\frac{5}{2} \\
\hline
\end{array}\]
The asymptotes are \(y = 0\) and \(x = 0\).
Now we can plot the graphs:
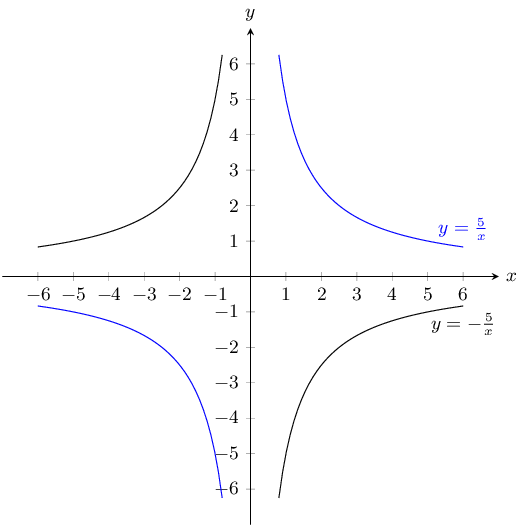
Reflection on the \(x\)-axis or reflection on the \(y\)-axis.
\(y = \dfrac{1}{x}\) and \(\dfrac{1}{2x}\)
\(a\) is positive for both graphs and so both graphs lie in the first and third quadrants.
For both graphs there is no \(y\)-intercept and no \(x\)-intercept.
We can plot the graphs from a table of values.
\(y = \frac{1}{x}\):
\[\begin{array}{|c|c|c|c|c|}
\hline
x & -2 & -1 & 1 & 2 \\ \hline
y & -\frac{1}{2} & -1 & 1 & \frac{1}{2} \\
\hline
\end{array}\]
\(y = \frac{1}{2x}\):
\[\begin{array}{|c|c|c|c|c|}
\hline
x & -2 & -1 & 1 & 2 \\ \hline
y & -\frac{1}{4} & -\frac{1}{2} & \frac{1}{2} & \frac{1}{4} \\
\hline
\end{array}\]
The asymptotes for both graphs are \(y = 0\) and \(x = 0\).
Now we can plot the graphs:
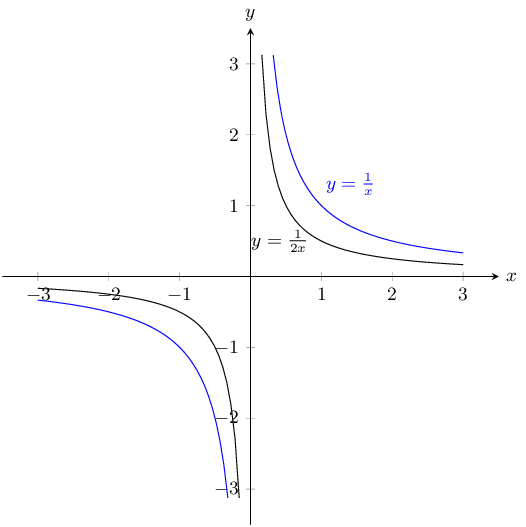
Reduction by 2
