\(y = x - 1\)
\(x\)-intercept \(=1\) and \(y\)-intercept \(=-1\)
|
Previous
6.1 Introduction
|
Next
6.3 Quadratic functions
|
Functions of the form \(y=mx+c\) are called straight line functions. In the equation, \(y=mx+c\), \(m\) and \(c\) are constants and have different effects on the graph of the function.
Complete the following table for \(f(x)=x\) and plot the points on a set of axes.
|
\(x\) |
\(-\text{2}\) |
\(-\text{1}\) |
\(\text{0}\) |
\(\text{1}\) |
\(\text{2}\) |
|
\(f(x)\) |
\(-\text{2}\) |
Join the points with a straight line.
Determine the domain and range.
About which line is \(f\) symmetrical?
Using the graph, determine the value of \(x\) for which \(f(x)=4\). Confirm your answer graphically.
Where does the graph cut the axes?
|
\(x\) |
\(-\text{2}\) |
\(-\text{1}\) |
\(\text{0}\) |
\(\text{1}\) |
\(\text{2}\) |
|
\(f(x)\) |
\(-\text{2}\) |
\(-\text{1}\) |
\(\text{0}\) |
\(\text{1}\) |
\(\text{2}\) |
From the table, we get the following points and the graph:
\((-2;-2), (-1;-1), (0;0), (1;1), (2;2)\)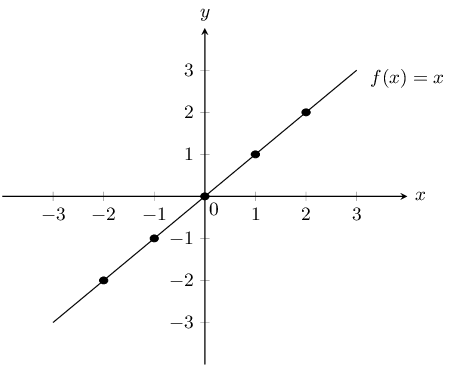
Domain: \(x\in \mathbb{R}\)
Range: \(f(x)\in \mathbb{R}\)
From the graph we see that when \(f(x)=4\), \(x=4\). This gives the point \((4;4)\).
The function \(f\) intercepts the axes at the origin \((0;0)\).
On the same set of axes, plot the following graphs:
\(y=x-2\)
\(y=x-1\)
\(y=x\)
\(y=x+1\)
\(y=x+2\)
Use your results to deduce the effect of different values of \(c\) on the graph.
On the same set of axes, plot the following graphs:
\(y=-2x\)
\(y=-x\)
\(y=x\)
\(y=2x\)
Use your results to deduce the effect of different values of \(m\) on the graph.
The effect of \(m\)
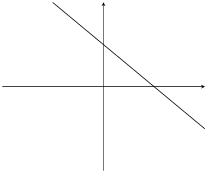
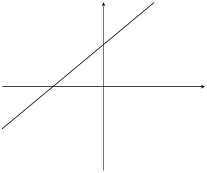
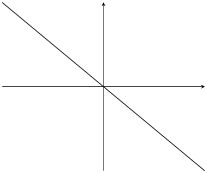
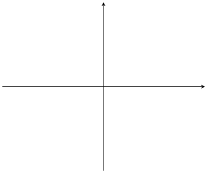
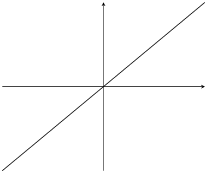
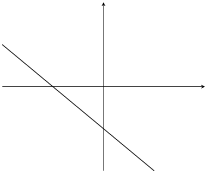
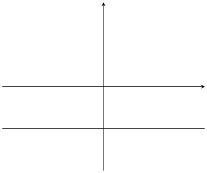
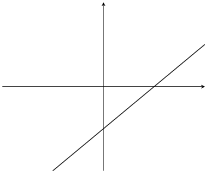
We notice that the value of \(m\) affects the slope of the graph. As \(m\) increases, the gradient of the graph increases.
If \(m>0\) then the graph increases from left to right (slopes upwards).
If \(m<0\) then the graph increases from right to left (slopes downwards). For this reason, \(m\) is referred to as the gradient of a straight-line graph.
The effect of \(c\)
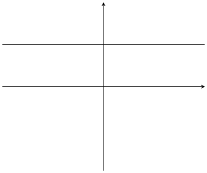
We also notice that the value of \(c\) affects where the graph cuts the \(y\)-axis. For this reason, \(c\) is known as the \(y\)-intercept.
If \(c>0\) the graph shifts vertically upwards.
If \(c<0\) the graph shifts vertically downwards.
|
\(m<0\) |
\(m=0\) |
\(m>0\) |
|
|
\(c>0\) |
|
|
|
|
\(c=0\) |
|
|
|
|
\(c<0\) |
|
|
|
Table 6.1: The effect of \(m\) and \(c\) on a straight line graph.
You can use this Phet simulation to help you see the effects of changing \(m\) and \(c\).
The standard form of a straight line graph is the equation \(y=mx+c\).
The domain is \(\left\{x:x\in \mathbb{R}\right\}\) because there is no value of \(x\) for which \(f\left(x\right)\) is undefined.
The range of \(f\left(x\right)=mx+c\) is also \(\left\{f\left(x\right):f\left(x\right)\in \mathbb{R}\right\}\) because \(f\left(x\right)\) can take on any real value.
The \(y\)-intercept:
Every point on the \(y\)-axis has an \(x\)-coordinate of \(\text{0}\). Therefore to calculate the \(y\)-intercept, let \(x=0\).
For example, the \(y\)-intercept of \(g\left(x\right)=x-1\) is given by setting \(x=0\):
\begin{align*} g\left(x\right)& = x-1 \\ g\left(0\right)& = 0-1 \\ & = -1 \end{align*}This gives the point \(\left(0;-1\right)\).
The \(x\)-intercept:
Every point on the \(x\)-axis has a \(y\)-coordinate of \(\text{0}\). Therefore to calculate the \(x\)-intercept, let \(y=0\).
For example, the \(x\)-intercept of \(g\left(x\right)=x-1\) is given by setting \(y=0\):
\begin{align*} g\left(x\right)& = x-1 \\ 0& = x-1 \\ \therefore x& = 1 \end{align*}This gives the point \(\left(1;0\right)\).
In order to sketch graphs of the form, \(f\left(x\right)=mx+c\), we need to determine three characteristics:
sign of \(m\)
\(y\)-intercept
\(x\)-intercept
Only two points are needed to plot a straight line graph. The easiest points to use are the \(x\)-intercept and the \(y\)-intercept.
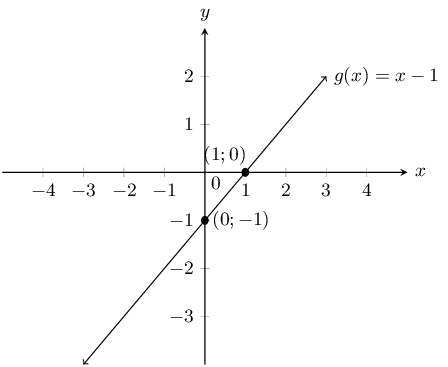
Sketch the graph of \(g(x)=x-1\) using the dual intercept method.
\(m>0\). This means that the graph increases as \(x\) increases.
For the \(y\)-intercept, let \(x=0\); therefore \(g(0)=-1\). This gives the point \((0;-1)\).
For the \(x\)-intercept, let \(y=0\); therefore \(x=1\). This gives the point \((1;0)\).
We can draw a straight line graph of the form \(y=mx+c\) using the gradient (\(m\)) and the \(y\)-intercept (\(c\)).
We calculate the \(y\)-intercept by letting \(x = 0\). This gives us one point \((0;c)\) for drawing the graph and we use the gradient to calculate the second point.
The gradient of a line is the measure of steepness. Steepness is determined by the ratio of vertical change to horizontal change:
\[m = \frac{\text{change in }y}{\text{change in }x} = \frac{\text{vertical change}}{\text{horizontal change}}\]For example, \(y = \frac{3}{2}x - 1\), therefore \(m > 0\) and the graph slopes upwards.
\[m = \frac{\text{change in }y}{\text{change in }x} = \frac{3\uparrow}{2\to }=\frac{-3\downarrow}{-2\leftarrow}\]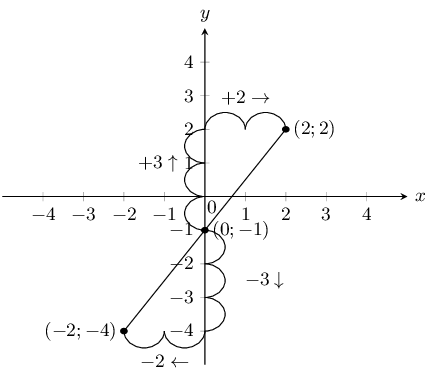
Sketch the graph of \(p(x) = \frac{1}{2}x - 3\) using the gradient-intercept method.
\(c=-3\), which gives the point \((0;-3)\).
Start at \((0;-3)\). Move \(\text{1}\) unit up and \(\text{2}\) units to the right. This gives the second point \((2;-2)\).
Or start at \((0;-3)\), move \(\text{1}\) unit down and \(\text{2}\) units to the left. This gives the second point \((-2;-4)\).
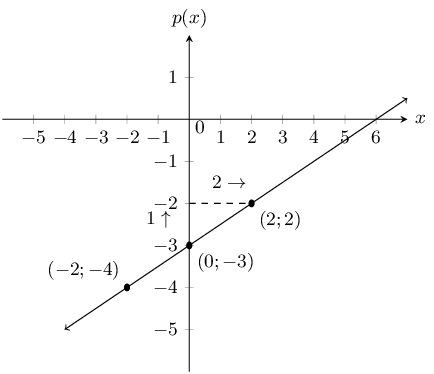
Always write the function in the form \(y = mx + c\) and take note of \(m\). After plotting the graph, make sure that the graph increases if \(m > 0\) and that the graph decreases if \(m < 0\).
Determine the \(x\)-intercept and the \(y\)-intercept of the following equations.
\(y = x - 1\)
\(x\)-intercept \(=1\) and \(y\)-intercept \(=-1\)
\(y = x + 2\)
\(x\)-intercept \(=-2\) and \(y\)-intercept \(=2\)
\(y = x - 3\)
\(x\)-intercept \(=3\) and \(y\)-intercept \(=-3\)
In the graph below there is a function with the equation \(y = mx + c\). Determine the values of \(m\) (the gradient of the line) and \(c\) (the \(y\)-intercept of the line).
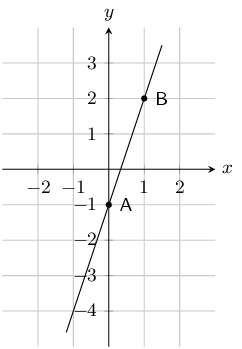
To determine \(m\), we use the coordinates of any other point on the line apart from the one used for the \(y\)-intercept. In this solution, we have chosen the coordinates of point \(B\) which are \((1;2)\).
From the \(y\)-intercept \(c = -1\).
\begin{align*} y & = mx + c \\ 2 & = m(1) - 1 \\ 2 & = m - 1 \\ 3 & = m \end{align*}\(m = 3\) and \(c = -1\).
The graph below shows a function with the equation \(y = mx + c\). Determine the values of \(m\) (the gradient of the line) and \(c\) (the \(y\)-intercept of the line).
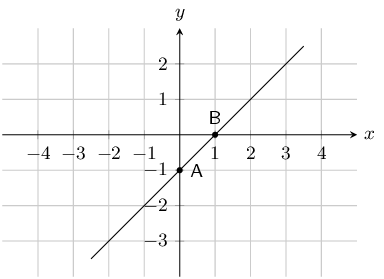
To determine \(m\), we use the coordinates of any other point on the line apart from the one used for the \(y\)-intercept. In this solution, we have chosen the coordinates of point \(B\) which are \((1;2)\).
From the \(y\)-intercept \(c = -1\).
\begin{align*} y & = mx + c \\ 0 & = m(1) - 1 \\ 0 & = m - 1 \\ 1 & = m \end{align*}\(m = 1\), and \(c = -1\).
List the \(x\) and \(y\)-intercepts for the following straight line graphs. Indicate whether the graph is increasing or decreasing:
To find the \(x\)-intercept we set \(y = 0\) and to find the \(y\)-intercept we set \(x = 0\). This gives the points \((0;1)\) and \((-1;0)\). The graph is increasing (\(m > 0\)).
To find the \(x\)-intercept we set \(y = 0\) and to find the \(y\)-intercept we set \(x = 0\). This gives the points \((0;-1)\) and \((1;0)\). The graph is increasing (\(m > 0\)).
To find the \(x\)-intercept we set \(y = 0\) and to find the \(y\)-intercept we set \(x = 0\). This gives the points \((0;-1)\) and \(\left(\frac{1}{2};0\right)\). The graph is increasing (\(m > 0\)).
To find the \(x\)-intercept we set \(y = 0\) and to find the \(y\)-intercept we set \(x = 0\). This gives the points \((0;1)\) and \(\left(\frac{1}{3};0\right)\). The graph is decreasing (\(m < 0\)).
To find the \(x\)-intercept we set \(y = 0\) and to find the \(y\)-intercept we set \(x = 0\). This gives the points \((0;2)\) and \(\left(-3;0\right)\). The graph is increasing (\(m > 0\)).
To find the \(x\)-intercept we set \(y = 0\) and to find the \(y\)-intercept we set \(x = 0\). This gives the point \((0;3)\). The graph is horizontal.
To find the \(x\)-intercept we set \(y = 0\) and to find the \(y\)-intercept we set \(x = 0\). This gives the same point for both intercepts: \((0;0)\). The graph is increasing (\(m > 0\)).
To find the \(x\)-intercept we set \(y = 0\) and to find the \(y\)-intercept we set \(x = 0\). This gives the points \((0;-3)\) and \(\left(2;0\right)\). The graph is increasing (\(m > 0\)).
State whether the following are true or not.
The gradient of \(2y = 3x -1\) is \(3\).
False
\begin{align*} 2y &= 3x -1 \\ y &= \frac{3}{2}x -{1}{2} \end{align*}Therefore the gradient is \(\frac{3}{2}\).
The \(y\)-intercept of \(y = x + 4\) is \(4\).
True
The gradient of \(2 - y = 2x - 1\) is \(-2\).
True
The gradient of \(y = \frac{1}{2}x - 1\) is \(-1\).
False
\[m = \frac{1}{2}\]The \(y\)-intercept of \(2y = 3x - 6\) is \(6\).
False
\begin{align*} 2y &= 3x - 6 \\ y &= \frac{3}{2}x - 3 \end{align*}Write the following in standard form (\(y = mx + c\)):
Look at the graphs below. Each graph is labelled with a letter. In the questions that follow, match any given equation with the label of a corresponding graph.
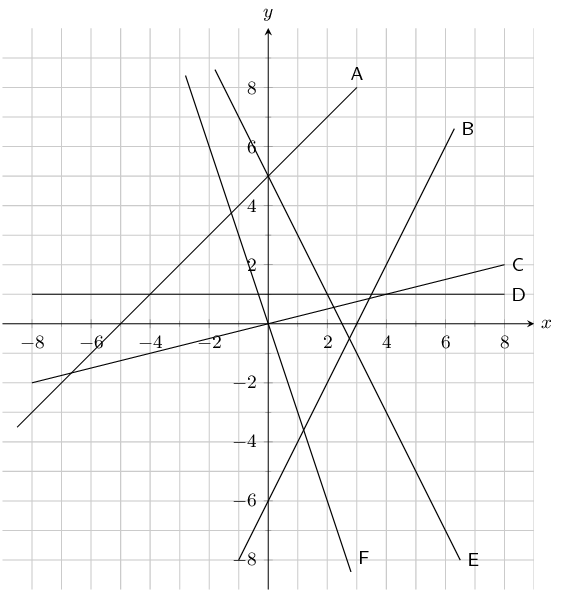
For the functions in the diagram below, give the equation of each line:
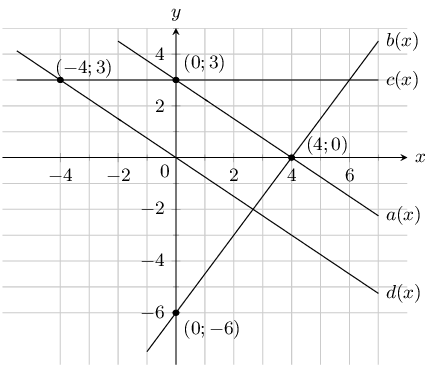
The \(y\)-intercept is \((0;3)\), therefore \(c = 3\).
\begin{align*} y & = mx + 3 \\ 0 & = 4m + 3 \\ \therefore m & = \frac{-3}{4} \end{align*}Therefore \(a(x) = -\frac{3}{4}x + 3\)
The \(y\)-intercept is \((0;-6)\), therefore \(c = -6\).
\begin{align*} y & = mx - 6 \\ 0 & = 4m - 6 \\ \therefore m & = \frac{3}{2} \end{align*}Therefore \(b(x) = \frac{3}{2}x - 6\)
The \(y\)-intercept is \((0;3)\), therefore \(c = 3\).
\begin{align*} y & = mx + 3 \\ 3 & = -4m + 3 \\ 0 & = -4m \\ \therefore m & = 0 \end{align*}Therefore \(c(x) = 3\)
The \(y\)-intercept is \((0;0)\), therefore \(c = 0\).
\begin{align*} y & = mx \\ 3 & = -4m \\ \therefore m & = \frac{-3}{4} \end{align*}Therefore \(d(x) = -\frac{3}{4}x\)
Sketch the following functions on the same set of axes, using the dual intercept method. Clearly indicate the coordinates of the intercepts with the axes and the point of intersection of the two graphs: \(x+2y-5=0\) and \(3x-y-1=0\).
For \(x+2y-5=0\):
We first write the equation in standard form: \(y = -\frac{1}{2}x + \frac{5}{2}\). From this we see that the \(y\)-intercept is \(\frac{5}{2}\). The \(x\)-intercept is \(\text{5}\).
For \(3x-y-1=0\):
We first write the equation in standard form: \(y = 3x - 1\). From this we see that the \(y\)-intercept is \(-\text{1}\). The \(x\)-intercept is \(\frac{1}{3}\).
To find the point of intersection we need to solve the two equations simultaneously. We can use the standard form of the first equation and substitute this value of \(y\) into the second equation:
\begin{align*} 3x + \frac{1}{2}x - \frac{5}{2} - 1 & = 0 \\ \frac{7}{2}x & = \frac{7}{2} \\ x & = 1 \end{align*}Substitute the value of \(x\) back into the first equation:
\begin{align*} x + 2y - 5 & = 0 \\ 1 + 2y - 5 & = 0 \\ 2y & = 4 \\ y & = 2 \end{align*}Therefore the graphs intersect at \((1;2)\).
Now we can sketch the graphs:
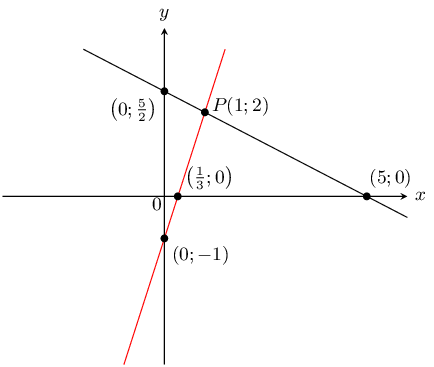
On the same set of axes, draw the graphs of \(f(x) = 3 - 3x\) and \(g(x) = \frac{1}{3}x+1\) using the gradient-intercept method.
For \(f(x) = 3 - 3x\) the \(y\)-intercept is 3. The gradient is \(-\text{3}\).
To get the second point we start at \((0;3)\) and move 3 units up and 1 unit to the left. This gives the second point \((-1;6)\). Or we can move 3 units down and 1 unit right to get \((1;0)\).
For \(g(x) = \frac{1}{3}x + 1\) the \(y\)-intercept is 1. The gradient is \(\frac{1}{3}\).
To get the second point we start at \((0;1)\) and move 1 unit up and 3 units to the right. This gives the second point \((3;2)\). Or we can move 1 unit down and 3 units left to get \((-3;0)\).
Now we can sketch the graphs.
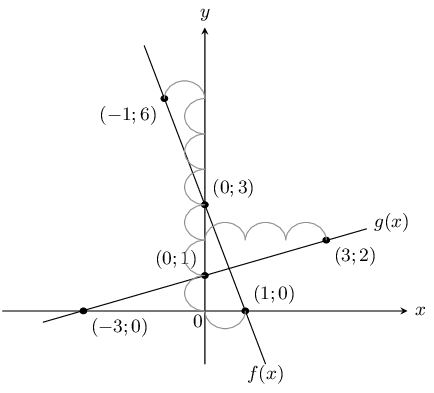
|
Previous
6.1 Introduction
|
Table of Contents |
Next
6.3 Quadratic functions
|