26.4 Relative frequency
So far, we have calculated the theoretical probabilities of events. Theoretical probabilities tell us what should happen in an experiment. The relative frequency tells us what actually happens in an experiment.
Relative frequency is the number of outcomes obtained for a certain number of trials. We have to repeat an experiment a number of times and count the number of positive outcomes. Because this is an experiment, which is an uncertain process, we can get a different relative frequency every time that we repeat the experiment.
- trial
- a completed run of a well-defined experiment
- positive outcome
- when we get an experiment outcome that we wanted to get
- frequency
- the number of times an event occurs
Examples of trials:
- rolling a fair dice
- drawing a card from a pack of cards
- tossing a fair coin
- turning a spinner
The relative frequency \((f)\) is the number of positive outcomes \((p)\) divided by the total number of trials \((t)\).
\[\text{Relative frequency} = \frac{\text{number of times an event occurs}}{\text{total number of trials conducted}}\] \[f = \frac{p}{t}\]- relative frequency
- the number of positive outcomes \((p)\) divided by the total number of trials \((t)\); it tells us what actually happened in an experiment
Worked example 26.4: Calculating relative frequency
We toss a coin \(20\) times and observe the outcomes. The results of the trials are listed below.
\[H; H; H; T; T; H; H; H; H; H; T; T; H; T; T; H; T; T; T; H\]- If you work out the relative frequency after the first \(10\) trials, what is the relative frequency of observing heads?
- What is the relative frequency of observing heads after \(15\) trials?
- What is the relative frequency of observing heads after \(20\) trials?
- Calculate the theoretical probability of observing heads.
- How does the relative frequency compare with the theoretical probability?
Calculate the relative frequency of observing heads after \(10\) trials.
For the first \(10\) trials, we observed \(8\) heads.
So for \(t = 10, p = 8\).
\[f = \frac{p}{t} = \frac{8}{10} = \text{0,8}\]Calculate the relative frequency of observing heads after \(15\) trials.
For the first \(15\) trials, we observed \(9\) heads.
So for \(t = 15, p = 9\).
\[f = \frac{p}{t} = \frac{9}{15} = \text{0,6}\]Calculate the relative frequency of observing heads after \(20\) trials.
For \(20\) trials, we observed \(11\) heads.
So for \(t = 20, p = 11\).
\[f = \frac{p}{t} = \frac{11}{20} = \text{0,55}\]Calculate the theoretical probability.
There are two possible outcomes; heads or tails. So \(n(S) = 2\).
\(E = {H}\), so \(n(E) = 1\).
\[\begin{align} P(E) &= \frac{n(E)}{n(S)} \\ &= \frac{1}{2} \\ &= \text{0,5} \end{align}\]Compare relative frequency and theoretical probability.
After \(20\) trials, the relative frequency of \(\text{0,55}\) is close to the theoretical probability of \(\text{0,5}\).
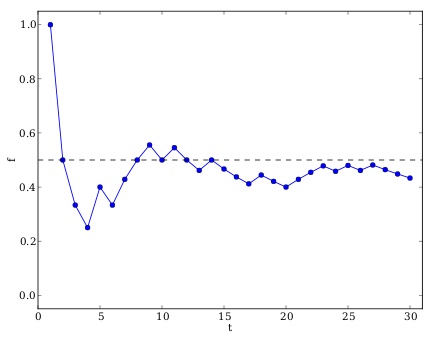
The greater the number of trials, the closer the relative frequency will get to the theoretical probability.
The graph below shows the plot of the relative frequency of observing heads (\(f\)) after having completed \(t\) coin tosses. The number of trials have been plotted on the \(x\)-axis and the relative frequency (\(f\)) on the \(y\)-axis.
In the beginning (after a small number of trials) the relative frequency changes a lot when compared to the theoretical probability at \(\text{0,5}\), which is shown with a dashed line. As the number of trials increases, the relative frequency changes less and gets closer to the theoretical probability.

