5.2 Independent and dependent values
When we look for relationships between two quantities, we are trying to understand whether one quantity has an influence on the other.
For example, look at the seven scenarios in the table below. There are two quantities in each scenario, but they do not always influence each other and when they do, there must be some kind of a rule or a relationship between them.
| Scenario | Quantities | Influence |
|---|---|---|
| Your age and the number of fingers on your hands | Age Number of fingers |
No influence |
| The number of calls you make and the airtime left on your cellphone | Number of calls Airtime |
The number of calls influences the amount of airtime. |
| The length of your arm and your ability to finish Mathematics tests quickly | Arm length Time to finish Mathematics test |
No influence |
| The number of identical houses to be built and the number of bricks required | Number of houses Number of bricks |
The number of houses that must be built influences the number of bricks that are needed. |
| The number of learners at a school and the duration of the school day | Number of learners Duration of school day |
No influence |
| The number of learners at a school and the number of classrooms needed | Number of learners Number of classrooms |
The number of learners influences the number of classrooms needed |
The number of matches in each arrangement here, and the number of triangles in the arrangement
 |
Number of matches Number of triangles |
The number of triangles influences the number of matches |
We can use flow diagrams and tables to show the connections between the quantities.
A flow diagram connects things in pairs and shows the connections with arrows. The arrows show which independent value (the “influencer”) is connected to which dependent value. In other words, the arrows show that a number on the left leads to some specific number on the right.
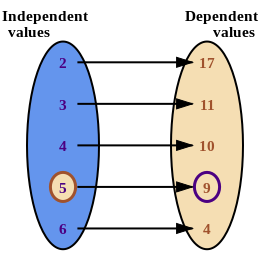
In this flow diagram, the \(5\) leads directly to the \(9\). So, the independent value, \(5\), influences the dependent value, \(9\).
An ordered pair is made of two numbers, and the independent value always comes first. An example of an ordered pair that you may know from working with graphs on the Cartesian plane is the coordinate pair \((x; y)\).
For the values in the flow diagram above, the independent value is \(5\) and it is connected to \(9\), so the correct ordered pair is \((5; 9)\).
Worked Example 5.1: Finding ordered pairs in flow diagrams
The flow diagram below shows the relationships (or connections) between various numbers.
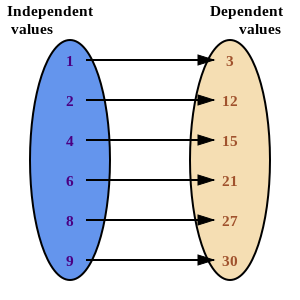
- Which number is connected to the independent value, \(8\)?
- Write an ordered pair to describe this connection.
Examine the flow diagram.
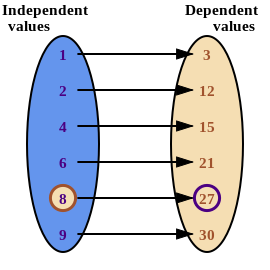
The \(8\) leads directly to the \(27\) So, the ordered pair is \((8; 27)\).
The table of values below shows connections between various numbers.
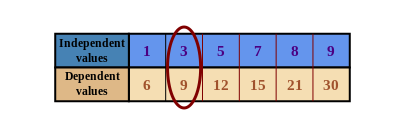
A table of values lists two groups of numbers. This table lists the independent values in the top row, and the dependent values in the bottom row. The numbers that are above and below each other make a special pair.
The \(3\) is paired with the \(9\), so we write the ordered pair as \((3; 9)\).
Worked Example 5.2: Finding ordered pairs in tables
This table of values shows connections between various numbers.
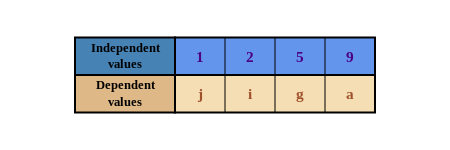
- Which letter is connected to the independent value, 2?
- Write an ordered pair that represents this connection.
Examine the table of values.
The \(2\) is paired with the \(i\), as you can see below.
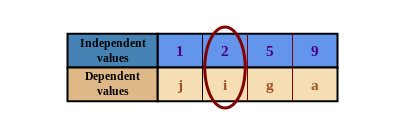
So, the correct ordered pair is \((2; i)\).
