Jane invested in the stock market.
The probability that she will not lose all her money is \(\text{0,32}\).
What is the probability that she will lose all her money?
Explain.
Since the events “Jane will lose all her money” and “Jane will not
lose all her money” are complementary events, their probabilities sum to
\(\text{1}\).
Therefore the probability that Jane will lose all her money is \(1 - \text{0,32} =
\text{0,68}\).
If \(D\) and \(F\) are mutually exclusive events, with \(P(\text{not } D) =
\text{0,3}\) and \(P(D \text{ or } F) = \text{0,94}\), find \(P(F)\).
Since \(D\) and \(F\) are mutually exclusive, the sum rule for mutually exclusive
events applies:
\[P(D \text{ or } F) = P(D) + P(F)\]
We are given \(P(\text{not } D) = \text{0,3}\), therefore \(P(D) = 1 - \text{0,3} =
\text{0,7}\).
From the sum rule we have
\begin{align*}
P(F)
&= P(D \text{ or } F) - P(D) \\
&= \text{0,94} - \text{0,7} \\
&= \text{0,24}
\end{align*}
The probability of event \(X\) is \(\text{0,43}\) and the probability of event \(Y\) is
\(\text{0,24}\).
The probability of both occurring together is \(\text{0,10}\).
What is the probability that \(X\) or \(Y\) will occur?
From the addition rule
\begin{align*}
P(X \text{ or } Y) &= P(X) + P(Y) - P(X \text{ and } Y) \\
&= \text{0,43} + \text{0,24} - \text{0,10} \\
&= \text{0,57}
\end{align*}
Use this information to draw a Venn diagram.
We first draw the outline of the Venn diagram.
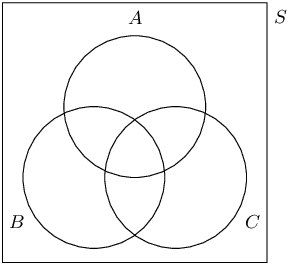
Next, we determine the counts of the different regions in the diagram, using the
information provided.
- There are \(\text{7}\) people who like all three neighbourhoods, so
\(n(A\text{ and }B\text{ and }C) = 7\).
- There are \(\text{21}\) people who like \(A\) and \(C\), so \(n(A\text{
and }C) = 21\).
- There are \(\text{18}\) people who like \(B\) and \(C\), so \(n(B\text{
and }C) = 18\).
- There are \(\text{40}\) people who like \(C\), so \(n(C) = 40\).
- Since \(\text{68}\) people like at least one neighbourhood and since there
are \(\text{80}\) people in total, \(\text{12}\) people like none of the
neighbourhoods.
Using the above information we can complete part of the Venn diagram.
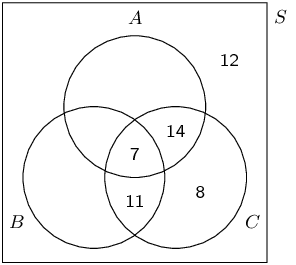
Since \(n(A\text{ or }B\text{ or }C) = 68\), we can see from the diagram above
that \(n(A\text{ or }B) = 60\).
From the sum rule
\[n(A\text{ and }B) = n(A) + n(B) - n(A\text{ or }B) = 40 + 35 - 60 = 15\]
This allows us to complete the diagram:
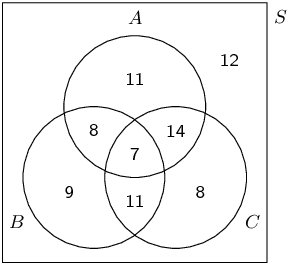
How many people like none of the neighbourhoods?
\(\text{12}\)
How many people like neighbourhoods \(A\) and \(B\), but not \(C\)?
\(\text{8}\)
What is the probability that a randomly chosen person from the survey
likes at least one of the neighbourhoods?
\(P(A\text{ or }B\text{ or }C) = \frac{68}{80} = \frac{17}{20}\)
A bag contains \(\text{10}\) orange balls and \(\text{7}\) black balls.
You draw \(\text{3}\) balls from the bag without replacement.
What is the probability that you will end up with exactly \(\text{2}\) orange balls?
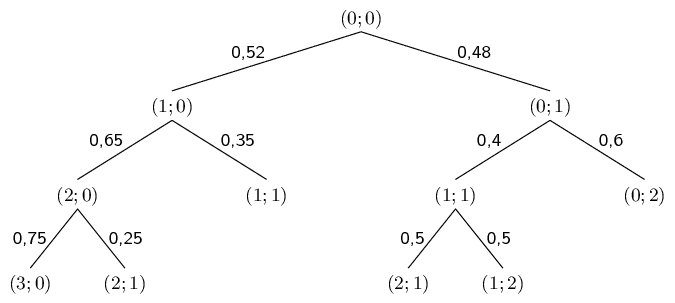
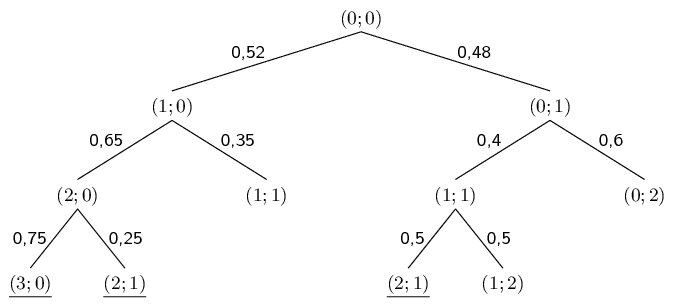
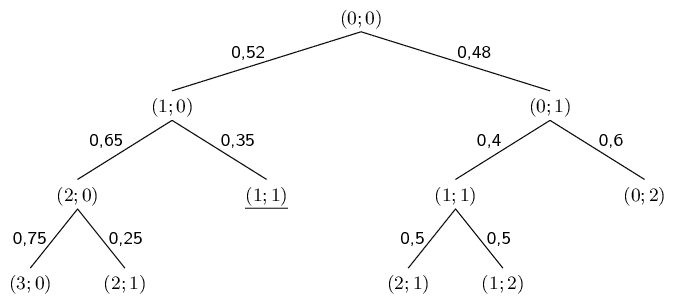
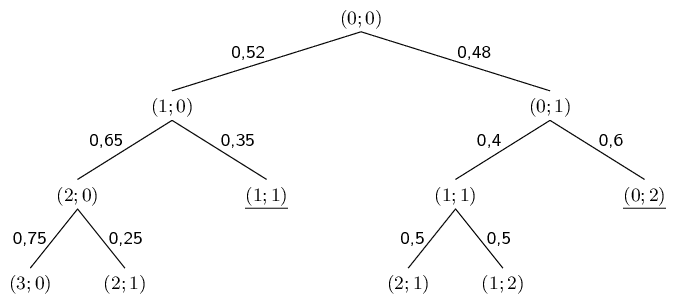
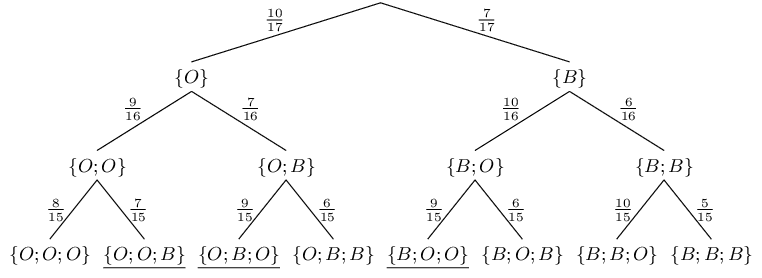
Represent this experiment using a tree diagram.
The tree diagram for the experiment is shown below.
Since balls are drawn without replacement, the total number of balls (which appears
in the denominators of the fractions) decreases by \(\text{1}\) at each step.
Depending on whether the ball drawn was orange or black, the numerator either
decreases by \(\text{1}\) or stays the same.
The outcomes containing exactly \(\text{2}\) orange balls are underlined.
Complete the following contingency table and determine whether the events are dependent
or independent.
|
Durban |
Bloemfontein |
Totals |
| Liked living there |
\(\text{130}\) |
\(\text{30}\) |
|
| Did not like living there |
\(\text{140}\) |
|
\(\text{340}\) |
| Totals |
|
\(\text{230}\) |
\(\text{500}\) |
We complete the contingency table by making sure that all the rows and columns sum to
the correct totals.
|
Durban |
Bloemfontein |
Totals |
| Liked living there |
\(\text{130}\) |
\(\text{30}\) |
\(\text{160}\) |
| Did not like living there |
\(\text{140}\) |
\(\text{200}\) |
\(\text{340}\) |
| Totals |
\(\text{270}\) |
\(\text{230}\) |
\(\text{500}\) |
Since
- \(P(\text{Durban}) = \frac{270}{500} = \text{0,54}\);
- \(P(\text{liked living there}) = \frac{160}{500} = \text{0,32}\);
- \(P(\text{Durban and liked living there}) = \frac{130}{500} = \text{0,26}\);
and since \(\text{0,54} \times \text{0,32} = \text{0,1728} \ne \text{0,26}\) the events
are dependent.
Summarise the following information about a medical trial with \(\text{2}\) types of
multivitamin in a contingency table and determine whether the events are dependent
or independent.
- \(\text{960}\) people took part in the medical trial.
- \(\text{540}\) people used multivitamin \(A\) for a month and \(\text{400}\) of
those people showed an improvement in their health.
- \(\text{300}\) people showed an improvement in health when using multivitamin
\(B\) for a month.
If the events are independent, it means that the two multivitamins have the same effect
on people.
If the events are dependent, it means that one multivitamin is better than the
other.
Which multivitamin is better than the other, or are the both equally effective?
From the information in the problem, we can draw up the following partially completed
contingency table.
|
Multivitamin \(A\) |
Multivitamin \(B\) |
Totals |
| Improvement in health |
\(\text{400}\) |
\(\text{300}\) |
|
| No improvement in health |
|
|
|
| Totals |
\(\text{540}\) |
|
\(\text{960}\) |
We complete the table by ensuring that all rows and columns add up to the correct
totals.
|
Multivitamin \(A\) |
Multivitamin \(B\) |
Totals |
| Improvement in health |
\(\text{400}\) |
\(\text{300}\) |
\(\text{700}\) |
| No improvement in health |
\(\text{140}\) |
\(\text{120}\) |
\(\text{260}\) |
| Totals |
\(\text{540}\) |
\(\text{420}\) |
\(\text{960}\) |
Since
- \(P(\text{Multivitamin A}) = \frac{540}{960} = \frac{9}{16}\);
- \(P(\text{Improvement in health}) = \frac{700}{960} = \frac{35}{48}\);
- \(P(\text{Multivitamin A and Improvement in health}) = \frac{400}{960} =
\frac{5}{12}\);
and since \(\frac{9}{16} \times \frac{35}{48} = \frac{105}{256} \ne \frac{5}{12}\) the
events are dependent.
With Multivitamin A, \(\frac{400}{540} = \text{74,1}\%\) of the people showed an
improvement in health.
With Multivitamin B, \(\frac{300}{420} = \text{71,4}\%\) of the people showed an
improvement in health.
Therefore Multivitamin A is more effective than Multivitamin B.

