Terminology (EMBJQ)
- Discuss terminology. This chapter has many words that can be confusing for learners.
- This chapter provides good opportunity for experiments and activities in classroom.
- Union and intersection symbols have been included, but “and” and “or” is the
preferred notation.
- The prime symbol has been included, but “not” is the preferred notation.
- It is very important to define the events: fair dice, full deck of cards etc.
Outcome: a single observation of an uncertain or random process (called an
experiment).
For example, when you accidentally drop a book, it might fall on its cover, on its back or on its side.
Each of these options is a possible outcome.
Sample space of an experiment: the set of all possible outcomes of the experiment.
For example, the sample space when you roll a single \(\text{6}\)-sided die is the set
\(\left\{1;2;3;4;5;6\right\}\).
For a given experiment, there is exactly one sample space.
The sample space is denoted by the letter \(S\).
Event: a set of outcomes of an experiment.
For example, during radioactive decay of \(\text{1}\) gramme of uranium-\(\text{234}\), one possible event is
that the number of alpha-particles emitted during \(\text{1}\) microsecond is between \(\text{225}\) and
\(\text{235}\).
Probability of an event: a real number between \(\text{0}\) and \(\text{1}\) that describes
how likely it is that the event will occur.
A probability of \(\text{0}\) means the outcome of the experiment will never be in the event set.
A probability of \(\text{1}\) means the outcome of the experiment will always be in the event set.
When all possible outcomes of an experiment have equal chance of occurring, the probability of an event is the
number of outcomes in the event set as a fraction of the number of outcomes in the sample space.
Relative frequency of an event: the number of times that the event occurs during experimental
trials, divided by the total number of trials conducted.
For example, if we flip a coin \(\text{10}\) times and it landed on heads \(\text{3}\) times, then the relative
frequency of the heads event is \(\frac{3}{10} = \text{0,3}\).
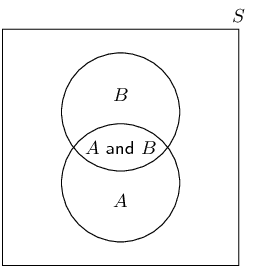
Union of events: the set of all outcomes that occur in at least one of the events.
For \(\text{2}\) events called \(A\) and \(B\), we write the union as “\(A \text{ or } B\)”.
Another way of writing the union is using set notation: \(A \cup B\).
Intersection of events: the set of all outcomes that occur in all of the events.
For \(\text{2}\) events called \(A\) and \(B\), we write the intersection as “\(A \text{ and } B\)”.
Another way of writing the intersection is using set notation: \(A \cap B\).
Mutually exclusive events: events with no outcomes in common, that is \((A \text{ and } B) =
\emptyset\).
Mutually exclusive events can never occur simultaneously.
For example the event that a number is even and the event that the same number is odd are mutually exclusive,
since a number can never be both even and odd.
Complementary events: two mutually exclusive events that together contain all the outcomes in
the sample space.
For an event called \(A\), we write the complement as “\(\text{not } A\)”.
Another way of writing the complement is as \(A'\).
Identities (EMBJR)
The addition rule (also called the sum rule) for any \(\text{2}\) events, \(A\) and \(B\) is
\[P(A \text{ or } B) = P(A) + P(B) - P(A \text{ and } B)\]
This rule relates the probabilities of \(\text{2}\) events with the probabilities of their union and
intersection.
The addition rule for \(\text{2}\) mutually exclusive events is
\[P(A \text{ or } B) = P(A) + P(B)\]
This rule is a special case of the previous rule.
Because the events are mutually exclusive, \(P(A \text{ and } B) = 0\).
The complementary rule is
\[P(\text{not } A) = 1 - P(A)\]
This rule is a special case of the previous rule. Since \(A\) and \((\text{not } A)\) are mutually exclusive,
\(P(A \text{ or } (\text{not } A)) = 1\).
Worked example 1: Events
You take all the hearts from a deck of cards.
You then select a random card from the set of hearts.
What is the sample space?
What is the probability of each of the following events?
- The card is the ace of hearts.
- The card has a prime number on it.
- The card has a letter of the alphabet on it.
Write down the sample space
Since we are considering only one suit from the deck of cards (the hearts), we need to write down only the
letters and numbers on the cards.
Therefore the sample space is
\[S = \{\text{A}; 2; 3; 4; 5; 6; 7; 8; 9; 10; \text{J}; \text{Q}; \text{K}\}\]
Write down the event sets
- ace of hearts: \(\{\text{A}\}\)
- prime number: \(\{2; 3; 5; 7\}\)
- letter of alphabet: \(\{\text{A}; \text{J}; \text{Q}; \text{K}\}\)
Compute the probabilities
The probability of an event is defined as the number of elements in the event set divided by the number of
elements in the sample space.
There are \(\text{13}\) elements in the sample space. So the probability of each event is
- ace of hearts: \(\frac{1}{13}\)
- prime number: \(\frac{4}{13}\)
- letter of alphabet: \(\frac{4}{13}\)
Worked example 2: Events
You roll two \(\text{6}\)-sided dice.
Let \(E\) be the event that the total number of dots on the dice is \(\text{10}\).
Let \(F\) be the event that at least one die is a \(\text{3}\).
- Write down the event sets for \(E\) and \(F\).
- Determine the probabilities for \(E\) and \(F\).
- Are \(E\) and \(F\) mutually exclusive? Why or why not?
Write down the sample space
The sample space of a single \(\text{6}\)-sided die is just \(\{1;2;3;4;5;6\}\).
To get the sample space of two \(\text{6}\)-sided dice, we have to take every possible pair of numbers from
\(\text{1}\) to \(\text{6}\).
\[S = \left\{\begin{array}{cccccc}
(1;1) & (1;2) & (1;3) & (1;4) & (1;5) & (1;6) \\
(2;1) & (2;2) & (2;3) & (2;4) & (2;5) & (2;6) \\
(3;1) & (3;2) & (3;3) & (3;4) & (3;5) & (3;6) \\
(4;1) & (4;2) & (4;3) & (4;4) & (4;5) & (4;6) \\
(5;1) & (5;2) & (5;3) & (5;4) & (5;5) & (5;6) \\
(6;1) & (6;2) & (6;3) & (6;4) & (6;5) & (6;6)
\end{array}\right\}\]
Write down the events
For \(E\) the dice have to add to \(\text{10}\).
\[E = \{(4;6); (5;5); (6;4)\}\]
For \(F\) at least one die has to be \(\text{3}\).
\[F = \{(1;3);(3;1);(2;3);(3;2);(3;3);(4;3);(3;4);(5;3);(3;5);(6;3);(3;6)\}\]
Compute the probabilities
The probability of an event is defined as the number of elements in the event set divided by the number of
elements in the sample space.
There are
- \(6 \times 6 = 36\) outcomes in the sample space, \(S\);
- \(\text{3}\) outcomes in event \(E\); and
- \(\text{11}\) outcomes in event \(F\).
Therefore
\[P(E) = \frac{3}{36} = \frac{1}{12}\]
and
\[P(F) = \frac{11}{36}\]
Are they mutually exclusive
To test whether two events are mutually exclusive, we have to test whether their intersection is empty.
Since \(E\) has no outcomes that contain a \(\text{3}\) on one of the dice, the intersection of \(E\) and
\(F\) is empty: \((E \text{ and } F) = \emptyset\).
This means that the events are mutually exclusive.
Revision
Textbook Exercise 10.1
A bag contains \(r\) red balls, \(b\) blue balls and \(y\) yellow balls. What is the probability that a
ball drawn from the bag at random is yellow?
To get the probability of drawing a yellow ball, we need to count the number of outcomes that result in
a yellow ball and divide by the total number of possible outcomes.
The number of yellow balls is \(y\) and the total number of balls is \(r+b+y\).
So, the probability of drawing a yellow ball is
\[P(\text{yellow}) = \frac{y}{r+b+y}\]
A packet has yellow and pink sweets.
The probability of taking out a pink sweet is \(\frac{7}{12}\).
What is the probability of taking out a yellow sweet?
Since there are only yellow and pink sweets in the packet the event of getting a yellow sweet is the
complement of the event of getting a pink sweet. So,
\begin{align*}
P(\text{yellow})
&= 1 - P(\text{pink}) \\
&= 1 - \frac{7}{12} \\
&= \frac{5}{12}
\end{align*}
You flip a coin \(\text{4}\) times.
What is the probability that you get \(\text{2}\) heads and \(\text{2}\) tails?
Write down the sample space and the event set to determine the probability of this event.
The sample space is the collection of all the ways in which a coin can land when we flip it
\(\text{4}\) times.
We use \(H\) to represent heads and \(T\) to represent tails.
The sample space is
\[S = \left\{\begin{array}{cccc}
(H;H;H;H) & (H;H;H;T) & (H;H;T;H) & (H;H;T;T) \\
(H;T;H;H) & (H;T;H;T) & (H;T;T;H) & (H;T;T;T) \\
(T;H;H;H) & (T;H;H;T) & (T;H;T;H) & (T;H;T;T) \\
(T;T;H;H) & (T;T;H;T) & (T;T;T;H) & (T;T;T;T)
\end{array}\right\}\]
We want to compute the probability of the event of getting \(\text{2}\) heads and \(\text{2}\) tails.
From the sample space, we find all the outcomes for which this is true:
\[E = \left\{(H;H;T;T); (H;T;H;T); (H;T;T;H); (T;H;H;T); (T;H;T;H); (T;T;H;H)\right\}\]
Since there are \(\text{6}\) outcomes in the event \(E\) and \(\text{16}\) outcomes in the sample space
\(S\), the probability of the event is \[P(E) = \frac{6}{16} = \frac{3}{8}\]
In a class of \(\text{37}\) children, \(\text{15}\) children walk to school, \(\text{20}\) children
have pets at home and \(\text{12}\) children who have a pet at home also walk to school. How many
children walk to school and do not have a pet at home?
Let \(E\) be the event that a child walks to school; and let \(F\) be the event that a child has a pet
at home.
Then, from the information in the problem statement
\begin{align*}
n(E) &= 15 \\
n(F) &= 20 \\
n(E \text{ and } F) &= 12
\end{align*}
We are asked to compute \(n(E \text{ and } (\text{not } F))\).
\begin{align*}
n(E \text{ and } (\text{not } F))
&= n(E) - n(E \text{ and } F) \\
&= 15 - 12 \\
&= \text{3}
\end{align*}
You roll two \(\text{6}\)-sided dice and are interested in the following two events:
- \(A\): the sum of the dice equals \(\text{8}\)
- \(B\): at least one of the dice shows a \(\text{1}\)
Show that these events are mutually exclusive.
The event \(A\) has the following elements:
\[\{(2;6); (3;5); (4;4); (5;3); (6;2)\}\]
Since \(A\) does not include any outcomes where a die shows a \(\text{1}\) and since \(B\) requires that
a die shows at least one \(1\), the two events can have no outcomes in common: \((A \text{ and } B) =
\emptyset\).
Therefore the events are, by definition, mutually exclusive.
You ask a friend to think of a number from \(\text{1}\) to \(\text{100}\).
You then ask her the following questions:
- Is the number even?
- Is the number divisible by \(\text{7}\)?
How many possible numbers are less than \(\text{80}\) if she answered “yes” to both
questions?
The first question requires the number to be divisible by \(\text{2}\).
The second question requires the number to be divisible by \(\text{7}\).
Therefore we should count the multiples of \(\text{14}\) that are less than \(\text{80}\).
These are \(\{14; 28; 42; 56; 70\}\), giving a total of \(\text{5}\) numbers.
both chips and Fanta
\(\frac{7}{42} = \frac{1}{6}\)
only Fanta
Since \(42 - 3 = 39\) had at least one of chips and a Fanta, and \(\text{23}\) had a packet of chips,
then \(39 - 23 = 16\) had only Fanta.
\[\frac{16}{42} = \frac{8}{21}\]
orange
\(\frac{8}{18} = \frac{4}{9}\)
not orange
\(1 - \frac{4}{9} = \frac{5}{9}\)
pink
\(\frac{2}{18} = \frac{1}{9}\)
not pink
\(1 - \frac{1}{9} = \frac{8}{9}\)
orange or pink
\(\frac{1}{9} + \frac{4}{9} = \frac{5}{9}\)
neither orange nor pink
\(1 - \frac{5}{9} = \frac{4}{9}\)
purple
Before we answer the questions we first work out how many blocks there are in total.
This gives us the size of the sample space as
\[n(S) = 24 + 32 + 41 + 19 = \text{116}\]
The probability that a block is purple is:
\begin{align*}
P(\text{purple})
&= \frac{n(E)}{n(S)} \\
&= \frac{24}{\text{116}} \\
&= \text{0,21}
\end{align*}
purple or white
The probability that a block is either purple or white is:
\begin{align*}
P(\text{purple or white})
&= P(\text{purple}) + P(\text{white}) \\
&= \frac{24}{\text{116}} + \frac{41}{\text{116}} \\
&= \text{0,56}
\end{align*}
pink and orange
Since one block cannot be two colours the probability of this event is \(\text{0}\).
not orange?
We first work out the probability that a block is orange:
\begin{align*}
P(\text{orange})
&= \frac{\text{32}}{\text{116}} \\
&= \text{0,28}
\end{align*}
The probability that a block is not orange is:
\begin{align*}
P(\text{not orange})
&= \text{1} - \text{0,28} \\
&= \text{0,72}
\end{align*}
The surface of a soccer ball is made up of \(\text{32}\) faces.
\(\text{12}\) faces are regular pentagons, each with a surface area of about \(\text{37}\)
\(\text{cm$^{2}$}\).
The other \(\text{20}\) faces are regular hexagons, each with a surface area of about \(\text{56}\)
\(\text{cm$^{2}$}\).
You roll the soccer ball.
What is the probability that it stops with a pentagon touching the ground?
Since a soccer ball is round, the probability of stopping on a face is proportional to the area of the
face.
There are \(\text{12}\) pentagons each with an area of \(\text{37}\) \(\text{cm$^{2}$}\), for a total
area of \(12 \times 37 = \text{444}\text{ cm$^{2}$}\).
There are \(\text{20}\) hexagons each with an area of \(\text{56}\) \(\text{cm$^{2}$}\), for a total
area of \(20 \times 56 = \text{1 120}\text{ cm$^{2}$}\).
So the probability of stopping on a pentagon is
\begin{align*}
\frac{\text{area of pentagons}}{\text{total area}}
&= \frac{444}{444+1120} \\
&= \text{0,28}
\end{align*}
to \(\text{2}\) decimal places.

