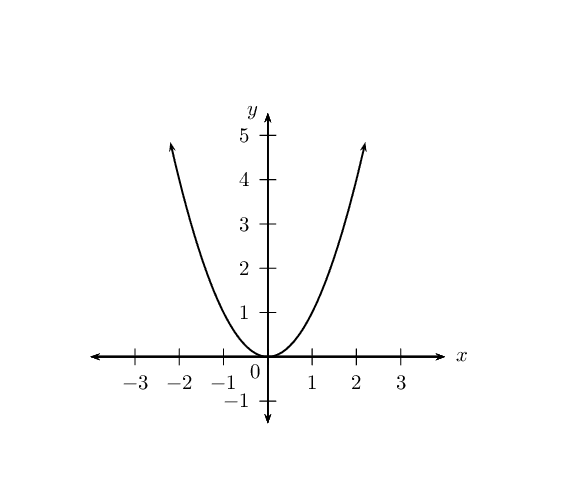
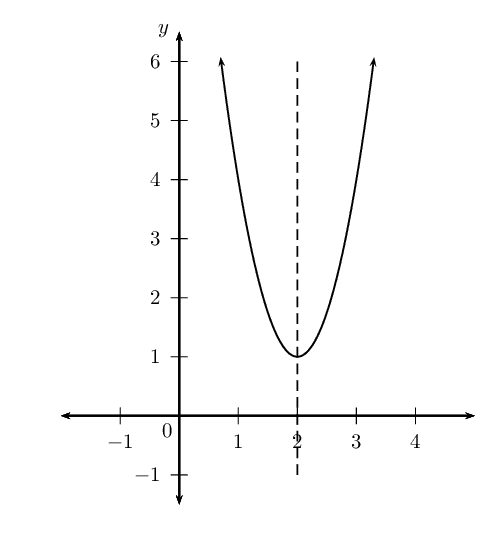
\(y_1 = x^2\)
|
Previous
End of chapter exercises
|
Next
5.2 Average gradient
|
A function describes a specific relationship between two variables; where an independent (input) variable has exactly one dependent (output) variable. Every element in the domain maps to only one element in the range. Functions can be one-to-one relations or many-to-one relations. A many-to-one relation associates two or more values of the independent variable with a single value of the dependent variable. Functions allow us to visualise relationships in the form of graphs, which are much easier to read and interpret than lists of numbers.
Functions of the general form \(y=a{x}^{2}+q\) are called parabolic functions, where \(a\) and \(q\) are constants.
The effects of \(a\) and \(q\) on \(f(x) = ax^2 + q\):
The effect of \(q\) on vertical shift
For \(q>0\), \(f(x)\) is shifted vertically upwards by \(q\) units.
The turning point of \(f(x)\) is above the \(x\)-axis.
For \(q<0\), \(f(x)\) is shifted vertically downwards by \(q\) units.
The turning point of \(f(x)\) is below the \(x\)-axis.
\(q\) is also the \(y\)-intercept of the parabola.
The effect of \(a\) on shape
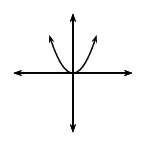
For \(a>0\); the graph of \(f(x)\) is a “smile” and has a minimum turning point \((0;q)\). As the value of \(a\) becomes larger, the graph becomes narrower.
As \(a\) gets closer to \(\text{0}\), \(f(x)\) becomes wider.
For \(a<0\); the graph of \(f(x)\) is a “frown” and has a maximum turning point \((0;q)\). As the value of \(a\) becomes smaller, the graph becomes narrower.
As \(a\) gets closer to \(\text{0}\), \(f(x)\) becomes wider.
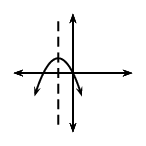
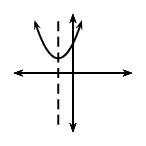
| \(a<0\) | \(a>0\) | |
| \(q>0\) | 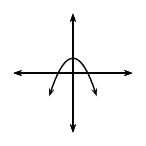 |
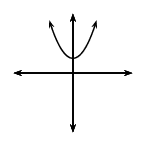 |
| \(q=0\) | 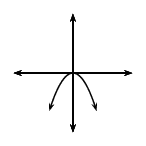 |
 |
| \(q<0\) | 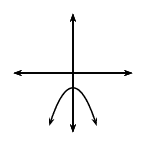 |
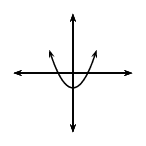 |
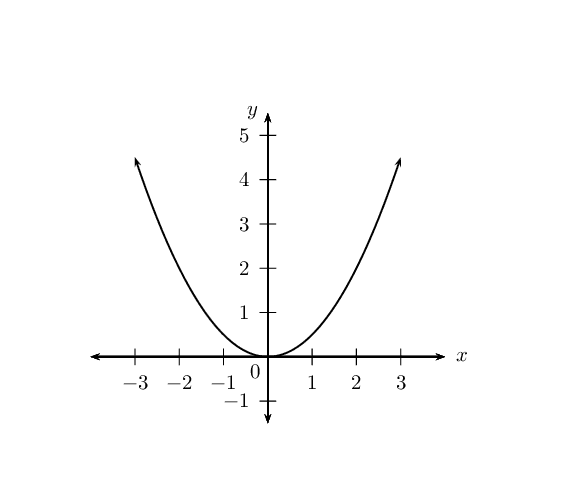
On separate axes, accurately draw each of the following functions.
\(y_1 = x^2\)

\(y_2 = \frac{1}{2}x^2\)
\(y_3 = -x^2 - 1\)
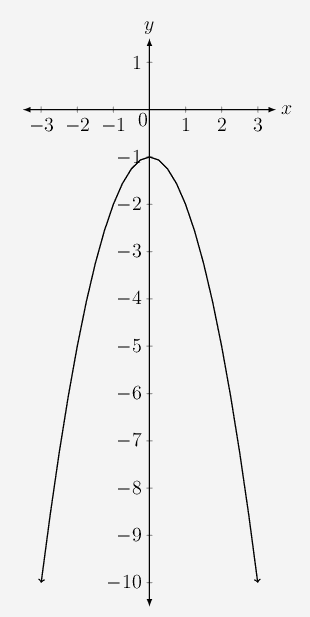
\(y_4 = -2x^2 + 4\)
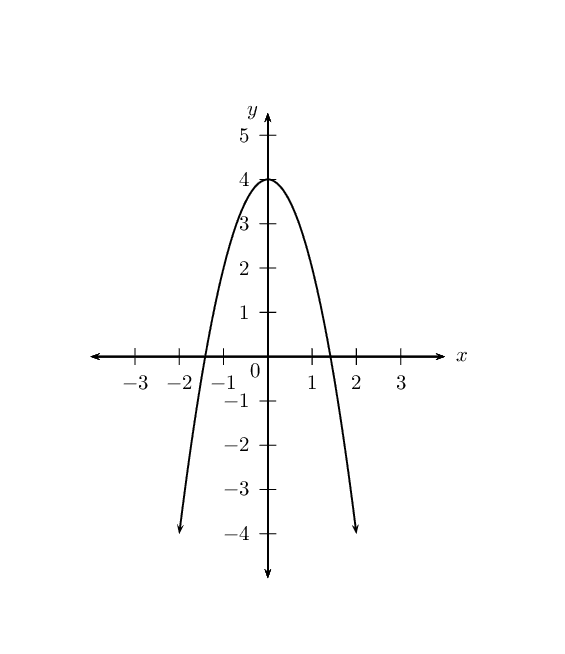
Use your sketches of the functions given above to complete the following table (the first column has been completed as an example):
| \(y_1\) | \(y_2\) | \(y_3\) | \(y_4\) | |
| value of \(q\) | \(q = 0\) | |||
| effect of \(q\) | \(y_{\text{int}} = 0\) | |||
| value of \(a\) | \(a = 1\) | |||
| effect of \(a\) | standard parabola | |||
| turning point | \((0;0)\) | |||
| axis of symmetry | \(x = 0\) (\(y\)-axis) | |||
| domain | \(\{x: x \in \mathbb{R} \}\) | |||
| range | \(\{y: y \geq 0\}\) |
| \(y_1\) | \(y_2\) | \(y_3\) | \(y_4\) | |
| value of \(q\) | \(q = \text{0}\) | \(q = \text{0}\) | \(q = -\text{1}\) | \(q = \text{4}\) |
| effect of \(q\) | \(y_{\text{int}} = 0\) | \(y_{\text{int}} = 0\) | \(y_{\text{int}} = -1\), shifts \(\text{1}\) unit down | \(y_{\text{int}} = 4\), shifts \(\text{4}\) unit up |
| value of \(a\) | \(a = 1\) | \(a = \frac{1}{2}\) | \(a = -1\) | \(a = -2\) |
| effect of \(a\) | standard parabola | smile, min. TP | frown, max. TP | frown, max. TP |
| turning point | \((0;0)\) | \((0;0)\) | \((0;-1)\) | \((0;4)\) |
| axis of symmetry | \(x = 0\) (\(y\)-axis) | \(x = 0\) (\(y\)-axis) | \(x = 0\) (\(y\)-axis) | \(x = 0\) (\(y\)-axis) |
| domain | \(\{x: x \in \mathbb{R} \}\) | \(\{x: x \in \mathbb{R} \}\) | \(\{x: x \in \mathbb{R} \}\) | \(\{x: x \in \mathbb{R} \}\) |
| range | \(\{y: y \geq 0\}\) | \(\{y: y \geq 0\}\) | \(\{y: y \leq -1\}\) | \(\{y: y \leq 4\}\) |
We now consider parabolic functions of the form \(y=a{\left(x+p\right)}^{2}+q\) and the effects of parameter \(p\).
On the same system of axes, plot the following graphs:
Use your sketches of the functions above to complete the following table:
| \(y_1\) | \(y_2\) | \(y_3\) | \(y_4\) | \(y_5\) | |
| \(x\)-intercept(s) | |||||
| \(y\)-intercept | |||||
| turning point | |||||
| axis of symmetry | |||||
| domain | |||||
| range | |||||
| effect of \(p\) |
On the same system of axes, plot the following graphs:
Use your sketches of the functions above to complete the following table:
| \(y_1\) | \(y_2\) | \(y_3\) | \(y_4\) | \(y_5\) | |
| \(x\)-intercept(s) | |||||
| \(y\)-intercept | |||||
| turning point | |||||
| axis of symmetry | |||||
| domain | |||||
| range | |||||
| effect of \(q\) |
Consider the three functions given below and answer the questions that follow:
What is the value of \(a\) for \(y_2\)?
Does \(y_1\) have a minimum or maximum turning point?
What are the coordinates of the turning point of \(y_2\)?
Compare the graphs of \(y_1\) and \(y_2\). Discuss the similarities and differences.
What is the value of \(a\) for \(y_3\)?
Will the graph of \(y_3\) be narrower or wider than the graph of \(y_1\)?
Determine the coordinates of the turning point of \(y_3\).
Compare the graphs of \(y_1\) and \(y_3\). Describe any differences.
The effect of the parameters on \(y = a(x + p)^2 + q\)
The effect of \(p\) is a horizontal shift because all points are moved the same distance in the same direction (the entire graph slides to the left or to the right).
For \(p>0\), the graph is shifted to the left by \(p\) units.
For \(p<0\), the graph is shifted to the right by \(p\) units.
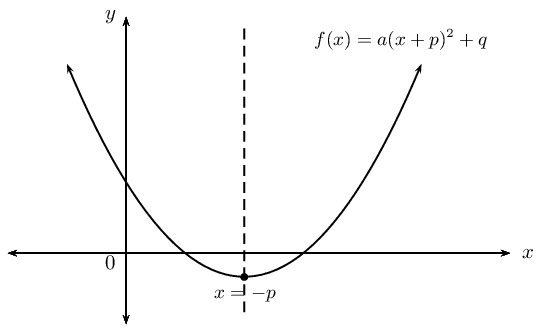
The value of \(p\) also affects whether the turning point is to the left of the \(y\)-axis \(\left(p>0\right)\) or to the right of the \(y\)-axis \(\left(p<0\right)\). The axis of symmetry is the line \(x = -p\).
The effect of \(q\) is a vertical shift. The value of \(q\) affects whether the turning point of the graph is above the \(x\)-axis \(\left(q>0\right)\) or below the \(x\)-axis \(\left(q<0\right)\).
The value of \(a\) affects the shape of the graph. If \(a<0\), the graph is a “frown” and has a maximum turning point. If \(a>0\) then the graph is a “smile” and has a minimum turning point. When \(a = 0\), the graph is a horizontal line \(y = q\).
|
\(p>0\) |
\(p<0\) |
|||
|
\(a<0\) |
\(a>0\) |
\(a<0\) |
\(a>0\) |
|
|
\(q>0\) |
 |
 |
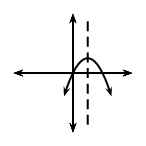 |
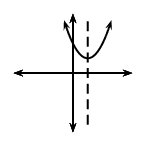 |
|
\(q<0\) |
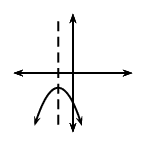 |
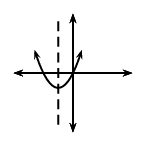 |
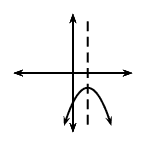 |
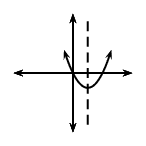 |
For functions of the general form \(f(x) = y = a(x + p)^2 + q\):
Domain and range
The domain is \(\left\{x:x\in ℝ\right\}\) because there is no value of \(x\) for which \(f(x)\) is undefined.
The range of \(f(x)\) depends on whether the value for \(a\) is positive or negative. If \(a>0\) we have: \[\begin{array}{r@{\;}c@{\;}l@{\quad}l} (x + p)^2 & \geq & 0 & (\text{perfect square is always positive}) \\ \therefore a(x + p)^2 & \geq & 0 & (a \text{ is positive}) \\ \therefore a(x + p)^2 + q & \geq & q & \\ \therefore f(x) & \geq & q & \end{array}\]
The range is therefore \(\{ y: y \geq q, y \in \mathbb{R} \}\) if \(a > 0\). Similarly, if \(a < 0\), the range is \(\{ y: y \leq q, y \in \mathbb{R} \}\).
State the domain and range for \(g(x) = -2(x - 1)^2 + 3\).
The domain is \(\{x: x \in \mathbb{R} \}\) because there is no value of \(x\) for which \(g(x)\) is undefined.
The range of \(g(x)\) can be calculated from: \begin{align*} (x - 1)^2& \geq 0 \\ -2(x - 1)^2& \leq 0 \\ -2(x - 1)^2 + 3 & \leq 3 \\ g(x) & \leq 3 \end{align*} Therefore the range is \(\{g(x): g(x) \leq 3 \}\) or in interval notation \((-\infty; 3]\).
Notice in the example above that it helps to have the function in the form \(y = a(x + p)^2 + q\).
We use the method of completing the square to write a quadratic function of the general form \(y = ax^2 + bx +c\) in the form \(y = a(x + p)^2 + q\) (see Chapter \(\text{2}\)).
Give the domain and range for each of the following functions:
\(f(x) = (x-4)^2 - 1\)
\(g(x) = -(x-5)^2 + 4\)
\(h(x) = x^2 -6x +9\)
\(j(x) = -2(x+1)^2\)
\(k(x) = -x^2 + 2x - 3\)
Intercepts
The \(y\)-intercept:
Every point on the \(y\)-axis has an \(x\)-coordinate of \(\text{0}\), therefore to calculate the \(y\)-intercept we let \(x=0\).
For example, the \(y\)-intercept of \(g(x) = (x - 1)^2 + 5\) is determined by setting \(x=0\): \begin{align*} g(x) &= (x - 1)^2 + 5 \\ g(0) &= (0 - 1)^2 + 5 \\ &= 6 \end{align*} This gives the point \((0;6)\).
The \(x\)-intercept:
Every point on the \(x\)-axis has a \(y\)-coordinate of \(\text{0}\), therefore to calculate the \(x\)-intercept we let \(y=0\).
For example, the \(x\)-intercept of \(g(x) = (x - 1)^2 + 5\) is determined by setting \(y=0\): \begin{align*} g(x) &= (x - 1)^2 + 5 \\ 0 &= (x - 1)^2 + 5 \\ -5 &= (x - 1)^2 \end{align*} which has no real solutions. Therefore, the graph of \(g(x)\) lies above the \(x\)-axis and does not have any \(x\)-intercepts.
Determine the \(x\)- and \(y\)-intercepts for each of the following functions:
\(f(x) = (x+4)^2 - 1\)
\(g(x) = \text{16} - 8x + x^2\)
\(h(x) = -x^2 +4x-3\)
\(j(x) = 4(x-3)^2 -1\)
\(k(x) = 4(x-3)^2 +1\)
\(l(x) = 2x^2 - 3x -4\)
Turning point
The turning point of the function \(f(x) = a(x+p)^2 + q\) is determined by examining the range of the function:
If \(a > 0\), \(f(x)\) has a minimum turning point and the range is \([q;\infty)\):
The minimum value of \(f(x)\) is \(q\).
If \(f(x) = q\), then \(a(x+p)^2 = 0\), and therefore \(x = -p\).
This gives the turning point \((-p;q)\).
If \(a < 0\), \(f(x)\) has a maximum turning point and the range is \((-\infty;q]\):
The maximum value of \(f(x)\) is \(q\).
If \(f(x) = q\), then \(a(x+p)^2 = 0\), and therefore \(x = -p\).
This gives the turning point \((-p;q)\).
Therefore the turning point of the quadratic function \(f(x) = a(x+p)^2 + q\) is \((-p;q)\).
Alternative form for quadratic equations:
We can also write the quadratic equation in the form
\[y = a(x - p)^2 +q\]The effect of \(p\) is still a horizontal shift, however notice that:
For \(p>0\), the graph is shifted to the right by \(p\) units.
For \(p<0\), the graph is shifted to the left by \(p\) units.
The turning point is \((p;q)\) and the axis of symmetry is the line \(x = p\).
Determine the turning point of \(g(x) = 3x^2 - 6x - 1\).
We use the method of completing the square: \begin{align*} g(x )&= 3x^2 - 6x - 1 \\ &= 3(x^2 - 2x) - 1 \\ &= 3 \left( (x-1)^2 - 1 \right) -1 \\ &= 3(x-1)^2 - 3 -1 \\ &= 3(x-1)^2 - 4 \end{align*}
From the equation \(g(x) = 3(x-1)^2 - 4\) we know that the turning point for \(g(x)\) is \((1;-4)\).
We use the method of completing the square: \begin{align*} h(x)&= ax^2 + bx + c \\ &= a \left( x^2 + \frac{b}{a}x + \frac{c}{a} \right) \end{align*}
Take half the coefficient of the \(x\) term and square it; then add and subtract it from the expression. \begin{align*} h(x) &= a \left( x^2 + \frac{b}{a}x + \left( \frac{b}{2a} \right)^2 - \left( \frac{b}{2a} \right)^2 + \frac{c}{a} \right) \\ &= a \left( \left(x + \frac{b}{2a} \right)^2 - \frac{b^2}{4a^2} + \frac{c}{a} \right) \\ &= a \left( \left(x + \frac{b}{2a} \right)^2 - \frac{b^2 -4ac}{4a^2} \right) \\ &= a \left(x + \frac{b}{2a} \right)^2 - \frac{b^2 -4ac}{4a} \end{align*} From the above we have that the turning point is at \(x = -p = - \frac{b}{2a}\) and \(y = q = - \frac{b^2 -4ac}{4a}\).
Write the equation in the general form \(y = ax^2 + bx + c\). \[k(x) = 5x^2 -10x + 2\] Therefore \(a = 5\); \(b = -10\); \(c = 2\).
Use the results obtained above to determine \(x = - \frac{b}{2a}\): \begin{align*} x &= -\left(\frac{-10}{2(5)}\right) \\ &= 1 \end{align*}
Substitute \(x = 1\) to obtain the corresponding \(y\)-value: \begin{align*} y &= 5x^2 -10x + 2 \\ &= 5(1)^2 -10(1) + 2\\ &= 5 - \text{10} + 2\\ &= -3 \end{align*} The turning point of \(k(x)\) is \((1;-3)\).
Determine the turning point of each of the following:
\(y = x^2 - 6x + 8\)
\(y = -x^2 + 4x - 3\)
\(y = \frac{1}{2}(x + 2)^2 - 1\)
\(y = 2x^2 + 2x + 1\)
\(y = \text{18} + 6x - 3x^2\)
\(y = -2[(x + 1)^2 + 3]\)
Axis of symmetry
The axis of symmetry for \(f(x)=a{\left(x+p\right)}^{2}+q\) is the vertical line \(x=-p\). The axis of symmetry passes through the turning point \((-p;q)\) and is parallel to the \(y\)-axis.
Determine the axis of symmetry of each of the following:
\(y = 2x^2 - 5x - \text{18}\)
\(y = 3(x - 2)^2 + 1\)
\(y = 4x - x^2\)
Write down the equation of a parabola where the \(y\)-axis is the axis of symmetry.
In order to sketch graphs of the form \(f(x)=a{\left(x+p\right)}^{2}+q\), we need to determine five characteristics:
sign of \(a\)
turning point
\(y\)-intercept
\(x\)-intercept(s) (if they exist)
domain and range
Sketch the graph of \(y = -\frac{1}{2}(x + 1)^2 - 3\).
Mark the intercepts, turning point and the axis of symmetry. State the domain and range of the function.
We notice that \(a < 0\), therefore the graph is a “frown” and has a maximum turning point.
From the equation we know that the turning point is \((-1; -3)\).
From the equation we know that the axis of symmetry is \(x = -1\).
The \(y\)-intercept is obtained by letting \(x = 0\): \begin{align*} y &= -\frac{1}{2} \left((0) + 1 \right)^2 - 3\\ &= -\frac{1}{2} - 3\\ &= -3\frac{1}{2} \end{align*} This gives the point \((0;-3\frac{1}{2})\).
The \(x\)-intercepts are obtained by letting \(y = 0\): \begin{align*} 0 &= -\frac{1}{2} \left(x + 1 \right)^2 - 3\\ 3 &= -\frac{1}{2} \left(x + 1 \right)^2 \\ -6 &= \left(x + 1 \right)^2 \end{align*} which has no real solutions. Therefore, there are no \(x\)-intercepts and the graph lies below the \(x\)-axis.
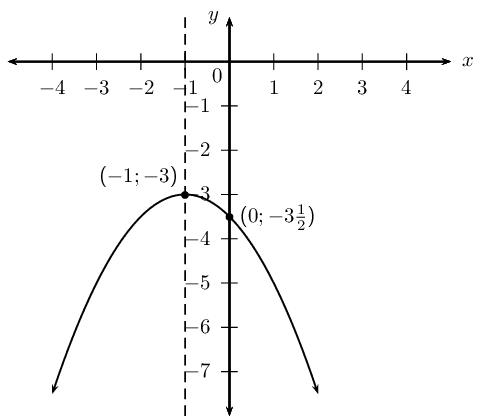
Domain: \(\{ x: x \in \mathbb{R} \}\)
Range: \(\{ y: y \leq -3, y \in \mathbb{R} \}\)
Sketch the graph of \(y = \frac{1}{2}x^2 - 4x + \frac{7}{2}\).
Determine the intercepts, turning point and the axis of symmetry. Give the domain and range of the function.
We notice that \(a > 0\), therefore the graph is a “smile” and has a minimum turning point.
Check that the equation is in standard form and identify the coefficients.
\[a = \frac{1}{2}; \qquad b = -4; \qquad c = \frac{7}{2}\]Calculate the \(x\)-value of the turning point using \begin{align*} x &= -\frac{b}{2a} \\ &= -\left(\frac{-4}{2\left( \frac{1}{2} \right)}\right) \\ &= 4 \end{align*} Therefore the axis of symmetry is \(x = 4\).
Substitute \(x = 4\) into the original equation to obtain the corresponding \(y\)-value. \begin{align*} y &= \frac{1}{2}x^2 - 4x + \frac{7}{2} \\ &= \frac{1}{2}(4)^2 - 4(4) + \frac{7}{2} \\ &= 8 -16 +\frac{7}{2} \\ &= -4\frac{1}{2} \end{align*} This gives the point \(\left( 4; -4\frac{1}{2} \right)\).
The \(y\)-intercept is obtained by letting \(x = 0\): \begin{align*} y &= \frac{1}{2}(0)^2 - 4(0) + \frac{7}{2}\\ &= \frac{7}{2} \end{align*} This gives the point \(\left(0;\frac{7}{2}\right)\).
The \(x\)-intercepts are obtained by letting \(y = 0\): \begin{align*} 0 &= \frac{1}{2}x^2 - 4x + \frac{7}{2} \\ &= x^2 - 8x + 7 \\ &= (x - 1)(x - 7) \end{align*} Therefore \(x = 1\) or \(x = 7\). This gives the points \((1;0)\) and \((7;0)\).
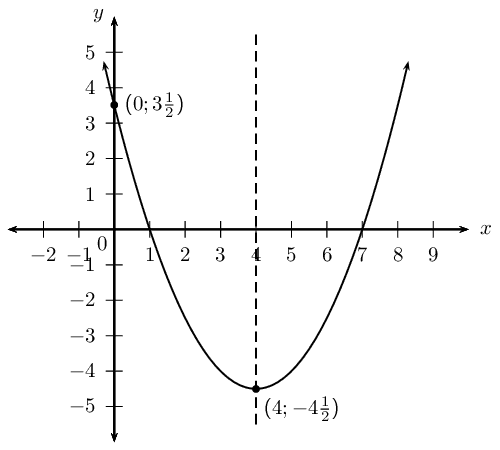
Domain: \(\{ x: x \in \mathbb{R} \}\)
Range: \(\{ y: y \geq -4\frac{1}{2}, y \in \mathbb{R} \}\)
Carl and Eric are doing their Mathematics homework and decide to check each others answers.
Homework question:
If the parabola \(y = 3x^2 + 1\) is shifted \(\text{2}\) units to the right, determine the equation of the new parabola.
Carl's answer:
A shift to the right means moving in the positive \(x\) direction, therefore \(x\) is replaced with \(x + 2\) and the new equation is \(y = 3(x + 2)^2 + 1\).
Eric's answer:
We replace \(x\) with \(x - 2\), therefore the new equation is \(y = 3(x - 2)^2 + 1\).
Work together in pairs. Discuss the two different answers and decide which one is correct. Use calculations and sketches to help explain your reasoning.
Writing an equation of a shifted parabola
The parabola is shifted horizontally:
If the parabola is shifted \(m\) units to the right, \(x\) is replaced by \((x-m)\).
If the parabola is shifted \(m\) units to the left, \(x\) is replaced by \((x+m)\).
The parabola is shifted vertically:
If the parabola is shifted \(n\) units down, \(y\) is replaced by \((y+n)\).
If the parabola is shifted \(n\) units up, \(y\) is replaced by \((y-n)\).
Given \(y = x^2 - 2x -3\).
If the parabola is shifted \(\text{1}\) unit to the right, determine the new equation of the parabola.
If the parabola is shifted \(\text{3}\) units down, determine the new equation of the parabola.
The parabola is shifted \(\text{1}\) unit to the right, so \(x\) must be replaced by \((x-1)\). \begin{align*} y &= x^2 - 2x -3\\ &= (x-1)^2 - 2(x-1) -3 \\ &= x^2 - 2x + 1 -2x + 2 - 3\\ &= x^2 - 4x \end{align*} Be careful not to make a common error: replacing \(x\) with \(x+1\) for a shift to the right.
The parabola is shifted \(\text{3}\) units down, so \(y\) must be replaced by \((y+3)\). \begin{align*} y + 3&= x^2 - 2x -3\\ y &= x^2 - 2x -3 - 3 \\ &= x^2 - 2x -6 \end{align*}
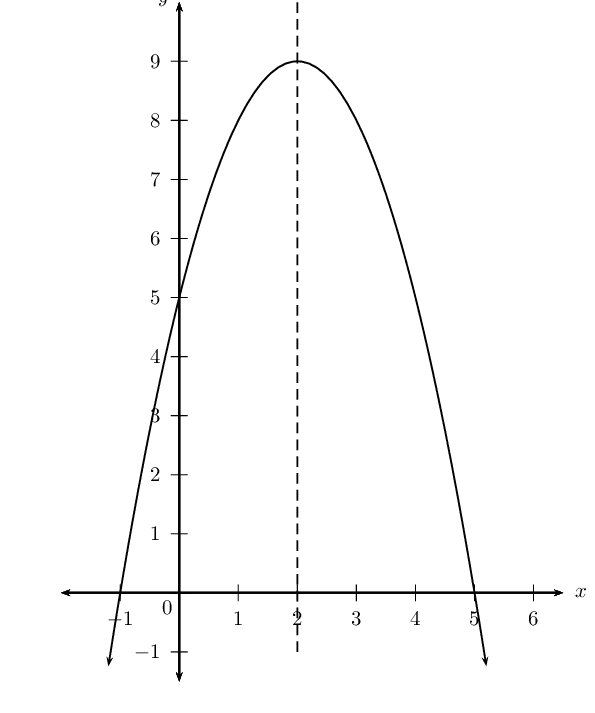
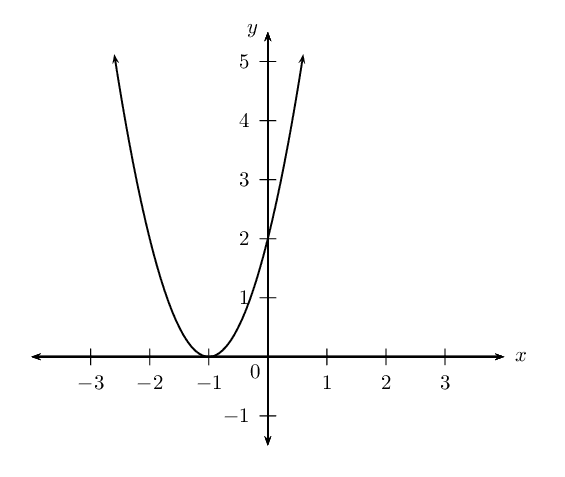
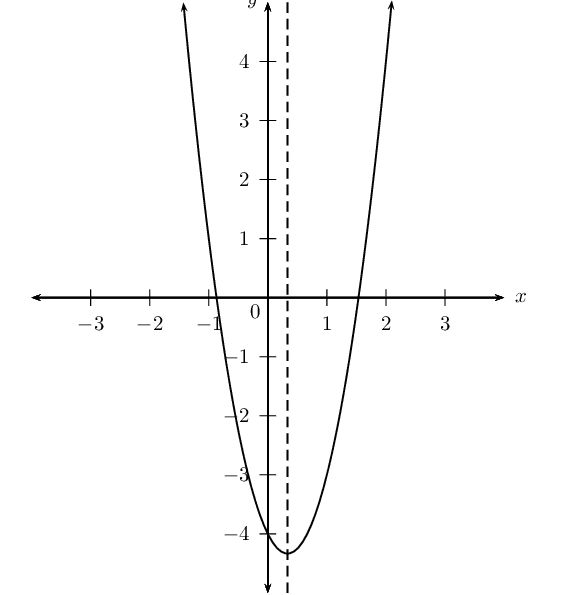
Sketch graphs of the following functions and determine:
\(y = -x^2 + 4x + 5\)
\(y = 2(x + 1)^2\)
\(y = 3x^2 - 2(x+2)\)
\(y = 3(x -2)^2 + 1\)
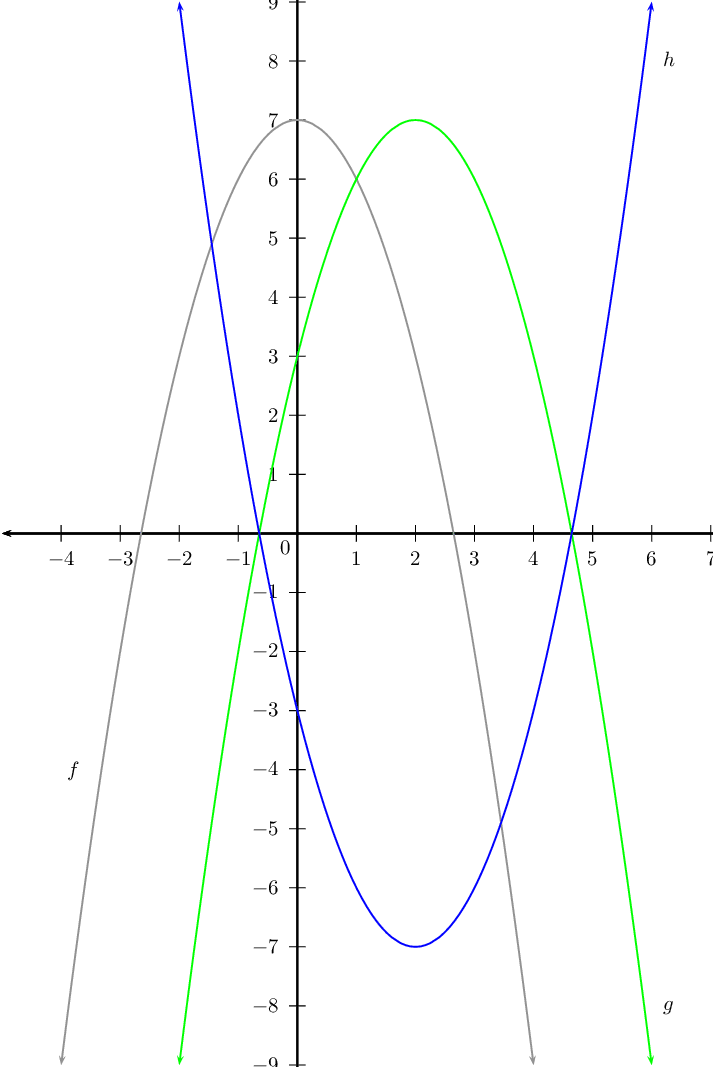
Draw the following graphs on the same system of axes:
\(f(x) = -x^2 + 7\)
\(g(x) = -(x - 2)^2 + 7\)
\(h(x) = (x - 2)^2 - 7\)
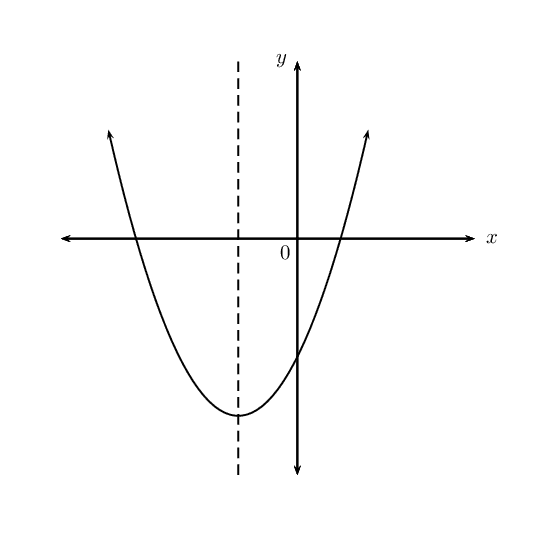
Draw a sketch of each of the following graphs:
\(y = ax^2 + bx + c\) if \(a > 0\), \(b > 0\), \(c < 0\).
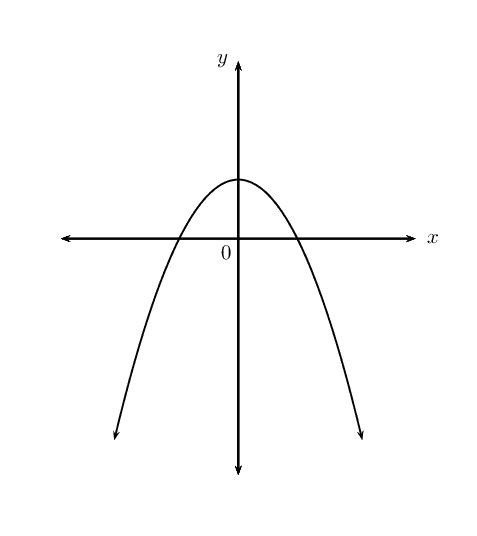
\(y = ax^2 + bx + c\) if \(a < 0\), \(b = 0\), \(c > 0\).
\(y = ax^2 + bx + c\) if \(a < 0\), \(b < 0\), \(b^2 - 4ac < 0\).
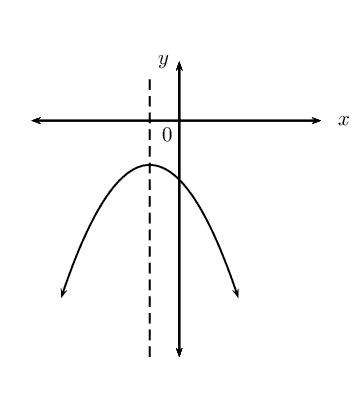
\(y = (x+p)^2 + q\) if \(p < 0\), \(q < 0\) and the \(x\)-intercepts have different signs.
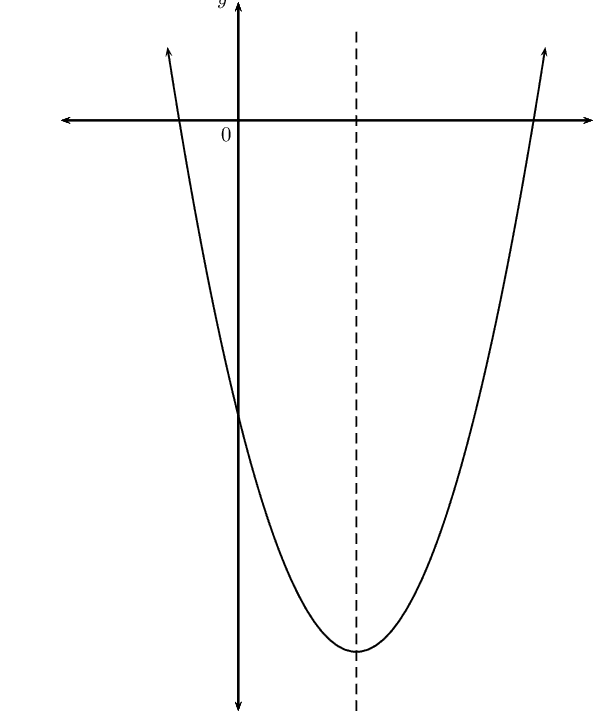
\(y = a(x+p)^2 + q\) if \(a < 0\), \(p < 0\), \(q > 0\) and one root is zero.
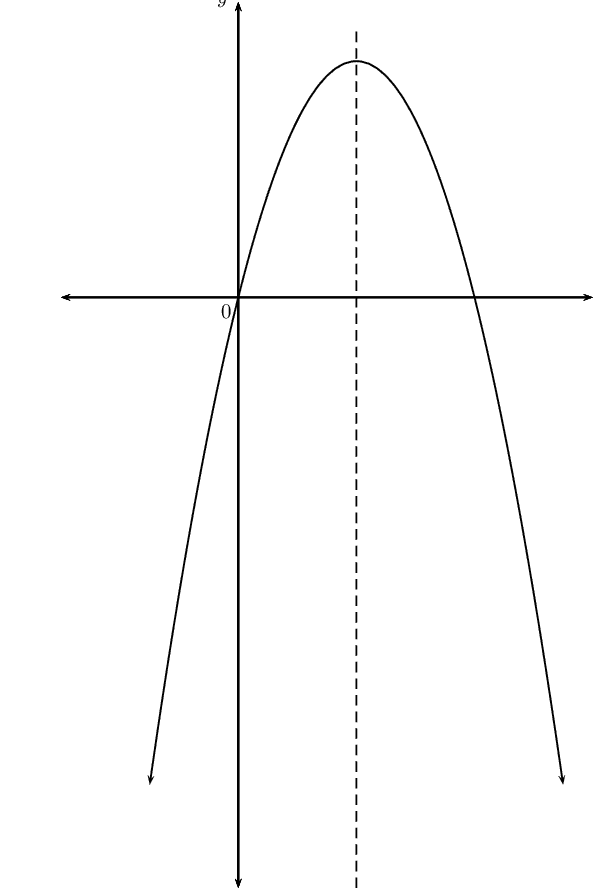
\(y = a(x+p)^2 + q\) if \(a > 0\), \(p = 0\), \(b^2 - 4ac > 0\).
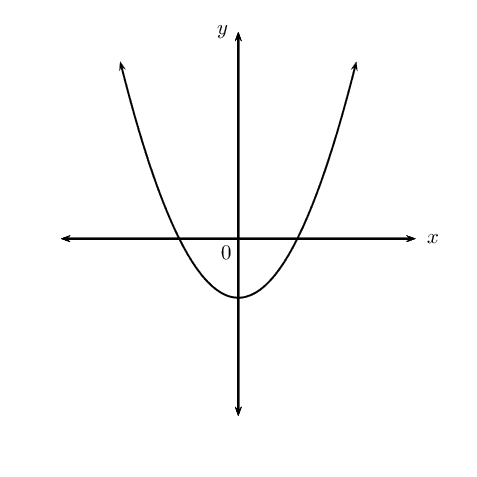
Determine the new equation (in the form \(y = ax^2 + bx + c\)) if:
\(y = 2x^2 + 4x + 2\) is shifted \(\text{3}\) units to the left.
\(y = -(x+1)^2\) is shifted \(\text{1}\) unit up.
\(y = 3(x-1)^2 + 2\left(x-\frac{1}{2}\right)\) is shifted \(\text{2}\) units to the right.
Finding the equation of a parabola from the graph
If the intercepts are given, use \(y = a(x - x_1)(x - x_2)\).
|
Example: 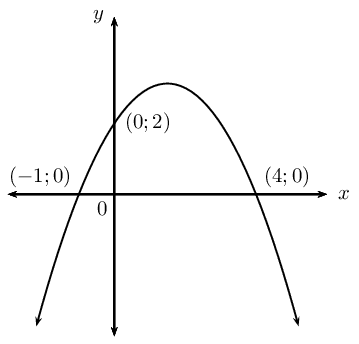
|
\(x\)-intercepts: \((-1;0)\) and \((4;0)\) \(\begin{aligned} y &= a(x -x_1)(x - x_2) \\ &= a(x + 1)(x - 4) \\ &= ax^2 - 3ax - 4a \end{aligned}\)\(y\)-intercept: \((0;2)\) \(\begin{aligned} -4a &= 2 \\ a &= -\frac{1}{2} \end{aligned}\)Equation of the parabola: \(\begin{aligned} y &= ax^2 - 3ax - 4a \\ &= -\frac{1}{2}x^2 - 3\left(-\frac{1}{2}\right)x - 4\left(-\frac{1}{2}\right) \\ &= -\frac{1}{2}x^2 + \frac{3}{2}x + 2 \end{aligned}\) |
If the \(x\)-intercepts and another point are given, use \(y = a(x -x_1)(x - x_2)\).
|
Example: 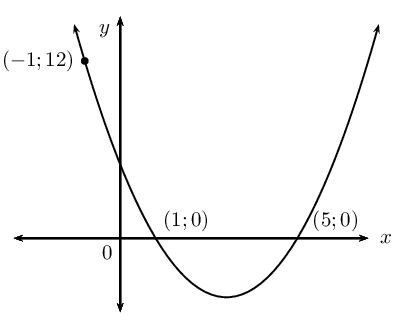
|
\(x\)-intercepts: \((1;0)\) and \((5;0)\) \(\begin{aligned} y &= a(x -x_1)(x - x_2) \\ &= a(x - 1)(x - 5) \\ &= ax^2 - 6ax + 5a \end{aligned}\)Substitute the point: \((-1;\text{12})\) \(\begin{aligned} \text{12} &= a(-1)^2 - 6a(-1) + 5a \\ \text{12} &= a + 6a + 5a \\ \text{12} &= 12a \\ 1 &= a \end{aligned}\)Equation of the parabola: \(\begin{aligned} y &= ax^2 - 6ax + 5a \\ &= x^2 - 6x + 5 \end{aligned}\) |
If the turning point and another point are given, use \(y = a(x + p)^2 + q\).
|
Example: 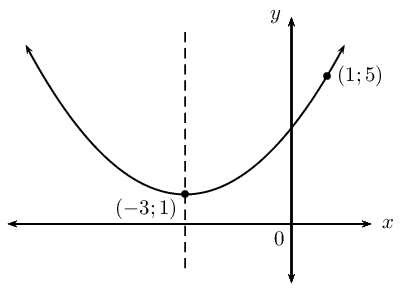
|
Turning point: \((-3;1)\) \(\begin{aligned} y &= a(x + p)^2 + q \\ &= a(x + 3)^2 + 1 \\ &= ax^2 + 6ax + 9a + 1 \end{aligned}\)Substitute the point: \((1;5)\) \(\begin{aligned} 5 &= a(1)^2 + 6a(1) + 9a + 1 \\ 4 &= 16a \\ \frac{1}{4} &= a \end{aligned}\)Equation of the parabola: \(y = \frac{1}{4}(x + 3)^2 + 1\) |
Determine the equations of the following graphs. Write your answers in the form \(y = a(x + p)^2 + q\).
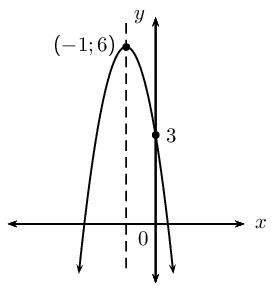
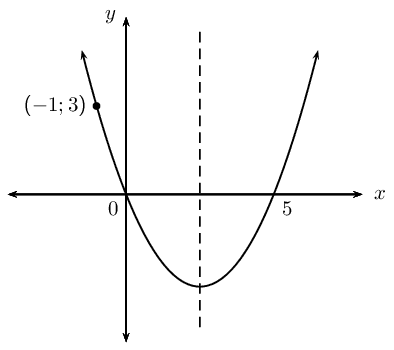
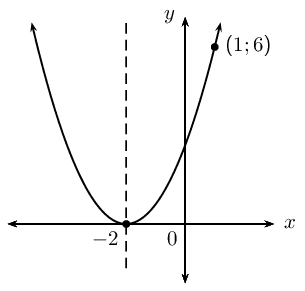
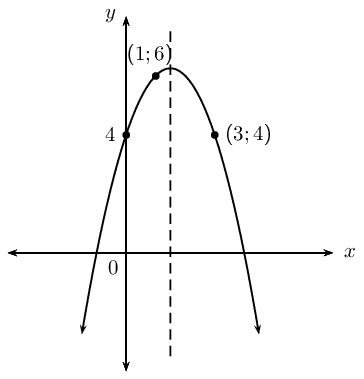
|
Previous
End of chapter exercises
|
Table of Contents |
Next
5.2 Average gradient
|