Home Practice
For learners and parents For teachers and schools
Textbooks
Full catalogue
Leaderboards
Learners Leaderboard Classes/Grades Leaderboard Schools Leaderboard
Pricing Support
Help centre Contact us
Log in

We think you are located in United States. Is this correct?

10.5 Five number summary

10.5 Five number summary (EMA7C)

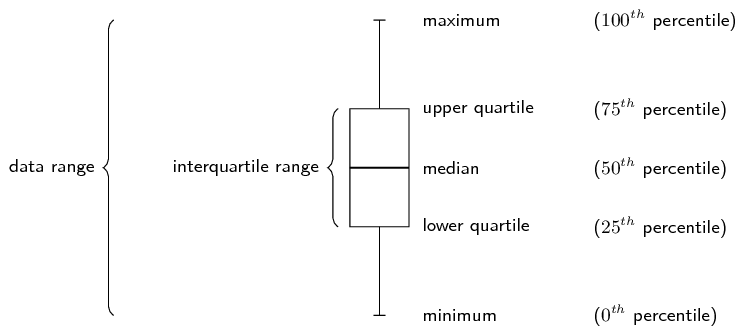
A common way of summarising the overall data set is with the five number summary and the box-and-whisker plot. These two represent exactly the same information, numerically in the case of the five number summary and graphically in the case of the box-and-whisker plot.

The five number summary consists of the minimum value, the maximum value and the three quartiles. Another way of saying this is that the five number summary consists of the following percentiles: \(0^{\text{th}}\), \(25^{\text{th}}\), \(50^{\text{th}}\), \(75^{\text{th}}\), \(100^{\text{th}}\).

The box-and-whisker plot shows these five percentiles as in the figure below. The box shows the interquartile range (the distance between \(Q_1\) and \(Q_3\)). A line inside the box shows the median. The lines extending outside the box (the whiskers) show where the minimum and maximum values lie. This graph can also be drawn horizontally.

5498b5406028c512c20f952d1d2f386b.png

This video explains how to draw a box-and-whisker plot for a data set.

Video: 2GNC

Wikihow shows a summary with short animations of how to make a box and whisker plot.

temp text

Worked example 14: Five number summary

Draw a box and whisker diagram for the following data set:

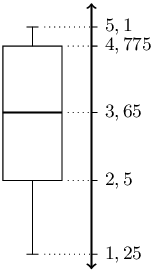
\[\left\{\text{1,25}; \text{1,5}; \text{2,5}; \text{2,5}; \text{3,1}; \text{3,2}; \text{4,1}; \text{4,25}; \text{4,75}; \text{4,8}; \text{4,95}; \text{5,1}\right\}\]

Determine the minimum and maximum

Since the data set is already sorted, we can read off the minimum as the first value (\(\text{1,25}\)) and the maximum as the last value (\(\text{5,1}\)).

Determine the quartiles

There are \(\text{12}\) values in the data set. Using the percentile formula, we can determine that the median lies between the sixth and seventh values, making it:

\[\frac{\text{3,2} + \text{4,1}}{2} = \text{3,65}\]

The first quartile lies between the third and fourth values, making it:

\[\frac{\text{2,5} + \text{2,5}}{2} = \text{2,5}\]

The third quartile lies between the ninth and tenth values, making it:

\[\frac{\text{4,75} + \text{4,8}}{2} = \text{4,775}\]

This provides the five number summary of the data set and allows us to draw the following box-and-whisker plot.

a113f43c6ddc661e9419eee46d6deb16.png

Textbook Exercise 10.6

Lisa is working in a computer store. She sells the following number of computers each month:

\[\left\{27; 39; 3; 15; 43; 27; 19; 54; 65; 23; 45; 16\right\}\]

Give the five number summary and box-and-whisker plot of Lisa's sales.

We first order the data set.

\[\left\{3; 15; 16; 19; 23; 27; 27; 39; 43; 45; 54; 65\right\}\]

Now we can read off the minimum as the first value (\(\text{3}\)) and the maximum as the last value (\(\text{65}\)).

Next we need to determine the quartiles.

There are \(\text{12}\) values in the data set. Using the percentile formula, we can determine that the median lies between the sixth and seventh values, making it:

\[\frac{\text{27} + \text{27}}{2} = \text{27}\]

The first quartile lies between the third and fourth values, making it:

\[\frac{\text{16} + \text{19}}{2} = \text{17,5}\]

The third quartile lies between the ninth and tenth values, making it:

\[\frac{\text{43} + \text{45}}{2} = \text{44}\]

This provides the five number summary of the data set and allows us to draw the following box-and-whisker plot.

Five number summary:

Minimum: \(3\)

\(Q_1\): \(\text{17,5}\)

Median: \(27\)

\(Q_3\): \(44\)

Maximum: \(65\)

Box-and-whisker plot:

ef6b3cbc074c173ef16f1eba922cd8e4.png

Zithulele works as a telesales person. He keeps a record of the number of sales he makes each month. The data below show how much he sells each month.

\[\left\{49; 12; 22; 35; 2; 45; 60; 48; 19; 1; 43; 12\right\}\]

Give the five number summary and box-and-whisker plot of Zithulele's sales.

We first order the data set.

\[\left\{1; 2; 12; 12; 19; 22; 35; 43; 45; 48; 49; 60\right\}\]

Now we can read off the minimum as the first value (\(\text{1}\)) and the maximum as the last value (\(\text{60}\)).

Next we need to determine the quartiles.

There are \(\text{12}\) values in the data set. Using the percentile formula, we can determine that the median lies between the sixth and seventh values, making it:

\[\frac{\text{22} + \text{35}}{2} = \text{28,5}\]

The first quartile lies between the third and fourth values, making it:

\[\frac{\text{12} + \text{12}}{2} = \text{12}\]

The third quartile lies between the ninth and tenth values, making it:

\[\frac{\text{45} + \text{48}}{2} = \text{46,5}\]

The five number summary is:

Minimum: \(1\)

\(Q_1\): \(12\)

Median: \(\text{28,5}\)

\(Q_3\): \(\text{46,5}\)

Maximum: \(60\)

The box and whisker plot is:

38f62e859550778ea2be3e4f1a43a972.png

Nombusa has worked as a florist for nine months. She sold the following number of wedding bouquets:

\[\left\{16; 14; 8; 12; 6; 5; 3; 5; 7\right\}\]

Give the five number summary of Nombusa's sales.

We first order the data set.

\[\left\{3; 5; 5; 6; 7; 8; 12; 14; 16\right\}\]

Now we can read off the minimum as the first value (\(\text{3}\)) and the maximum as the last value (\(\text{16}\)).

Next we need to determine the quartiles.

There are \(\text{9}\) values in the data set. Using the percentile formula, we can determine that the median lies at the fifth value, making it \(\text{7}\).

The first quartile lies at the third value, making it \(\text{5}\).

The third quartile lies at the seventh values, making it \(\text{12}\).

The five number summary is:

Minimum: \(3\)

\(Q_1\): \(5\)

Median: \(7\)

\(Q_3\): \(12\)

Maximum: \(16\)

Determine the five number summary for each of the box-and-whisker plots below.

1afc7807341229b5748f218b372c6a77.png

The box shows the interquartile range (the distance between \(Q1\) and \(Q3\)). A line inside the box shows the median. The lines extending outside the box (the whiskers) show where the minimum and maximum values lie. Reading off the graph we obtain the following five number summary:

Minimum: \(15\)

\(Q_1\): \(22\)

Median: \(25\)

\(Q_3\): \(28\)

Maximum: \(35\)

603d10cf4ef1764eb07def5fc7152c95.png

The box shows the interquartile range (the distance between \(Q1\) and \(Q3\)). A line inside the box shows the median. The lines extending outside the box (the whiskers) show where the minimum and maximum values lie. Reading off the graph we obtain the following five number summary:

Minimum: \(88\)

\(Q_1\): \(92\)

Median: \(98\)

\(Q_3\): \(100\)

Maximum: \(101\)