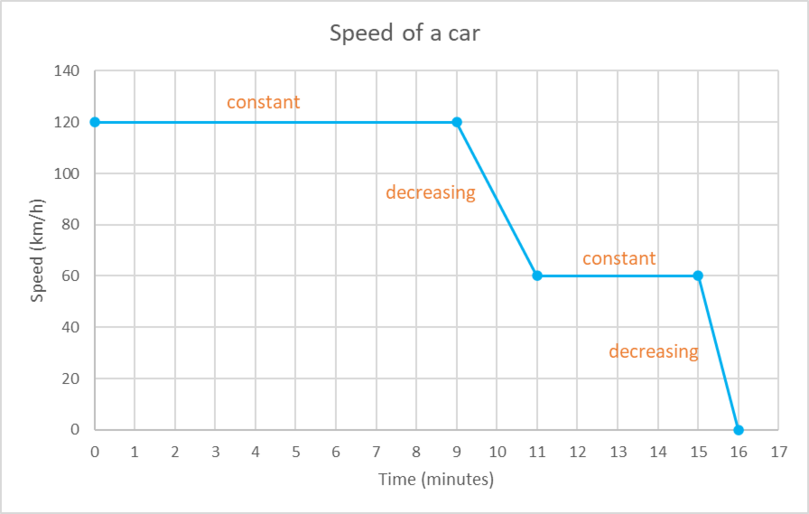
A car travels at a constant speed of \(120 \text{ km}{\cdot}\text{h}^{-1}\) for 9 minutes. Over the next 2
minutes, it reduces its speed at a steady rate until it reaches a speed of \(60 \text{
km}{\cdot}\text{h}^{-1}\). The car travels at \(60 \text{ km}{\cdot}\text{h}^{-1}\) for 4 minutes. Over the
next 1 minute, it reduces its speed at a steady rate and comes to a complete stop.
- Is the data in this situation discrete or continuous?
- Use the information provided to draw a suitable graph.
- On your graph indicate the sections where the graph is decreasing and constant.
- Continuous
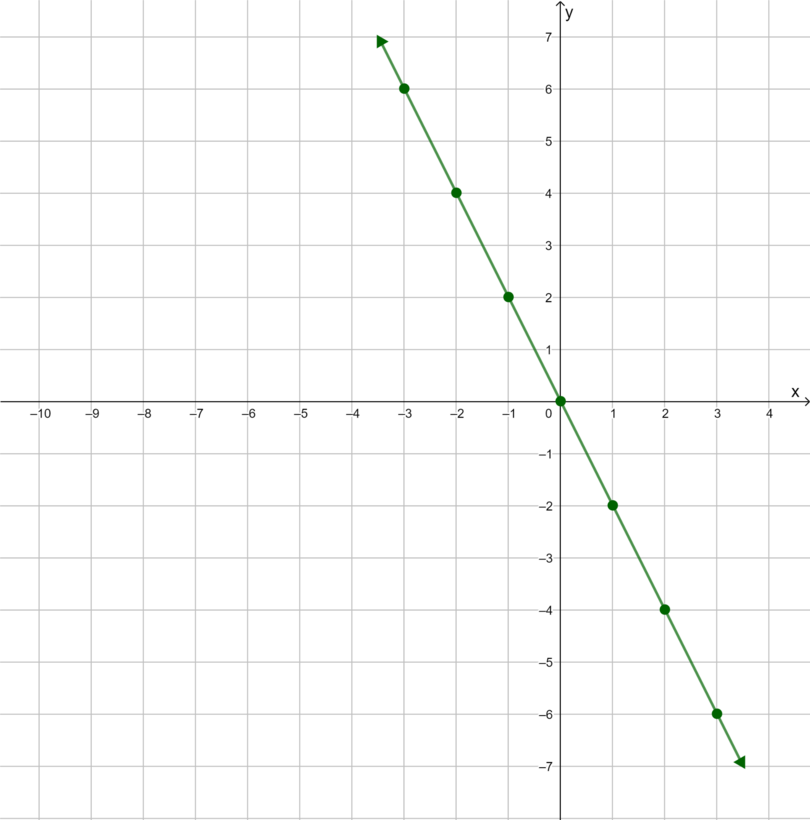
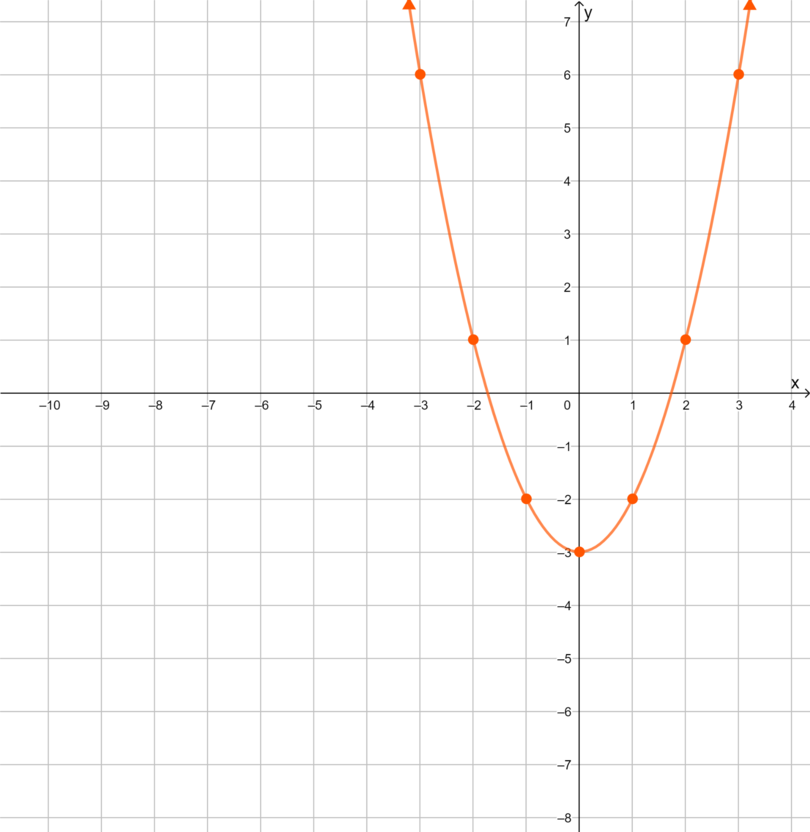
- and 3.


