Home Practice
For learners and parents For teachers and schools
Textbooks
Full catalogue
Leaderboards
Learners Leaderboard Classes/Grades Leaderboard Schools Leaderboard
Pricing Support
Help centre Contact us
Log in

We think you are located in United States. Is this correct?

Drawing graphs on the Cartesian plane from a table of values

23.6 Drawing graphs on the Cartesian plane from a table of values

Worked example 23.5: Plotting a line graph from a table of ordered pairs

\(x\) \(−3\) \(−2\) \(−1\) \(0\) \(1\) \(2\) \(3\)
\(y\)              
  1. Complete the table of ordered pairs for the linear equation \(y = 2x\).
  2. Plot the points on the Cartesian plane.
  3. Draw the graph by joining the points.

Complete the table of ordered pairs for the linear equation \(y = 2x\),

To complete the table of ordered pairs for the linear equation \(y = 2x\), we substitute each \(x\)-value into the equation to obtain the corresponding \(y\)-value:

Substituting \(x = -3\) into the equation \(y = 2x\), we get \(y = 2(-3) = −6\).
This is the point \((-3; -6)\).

Substituting \(x = -2\) into the equation \(y = 2x\), we get \(y = 2(-2) = −4\).
This is the point \((-2; -4)\).

Substituting \(x = -1\) into the equation \(y = 2x\), we get \(y = 2(-1) = −2\).
This is the point \((-1; -2)\).

Substituting \(x = 0\) into the equation \(y = 2x\), we get \(y = 2(0) = 0\).
This is the point \((0; 0)\).

Substituting \(x = 1\) into the equation \(y = 2x\), we get \(y = 2(1) = 2\).
This is the point \((1; 2)\).

Substituting \(x = 2\) into the equation \(y = 2x\), we get \(y = 2(2) = 4\).
This is the point \((2; 4)\).

Substituting \(x = 3\) into the equation \(y = 2x\), we get \(y = 2(3) = 6\).
This is the point \((3; 6)\).

\(x\) \(−3\) \(−2\) \(−1\) \(0\) \(1\) \(2\) \(3\)
\(y\) \(−6\) \(−4\) \(−3\) \(0\) \(2\) \(4\) \(6\)

Plot the points on the Cartesian plane and draw the graph.

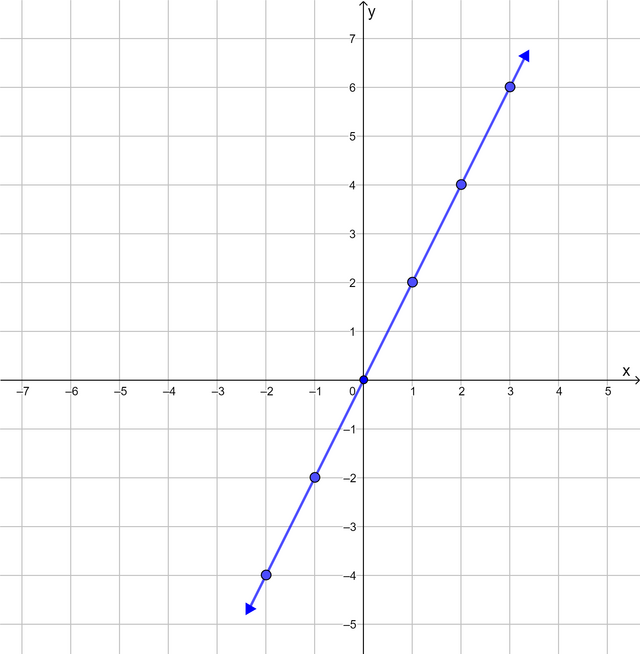
From the table of values, we obtain seven ordered pairs. We plot each point on the Cartesian plane and draw the graph by joining the points with a straight line.

Notice that the points form a straight line that passes through the origin. For each point on the line, the value of the \(y\)-coordinate is double the value of the \(x\)-coordinate.

Worked example 23.6: Plotting a curve from a table of ordered pairs

\(x\) \(−3\) \(−2\) \(−1\) \(0\) \(1\) \(2\) \(3\)
\(y\)              
  1. Complete the table of ordered pairs for the equation \(y = x^2 − 2\).
  2. Plot the points on the Cartesian plane.
  3. Draw the graph by joining the points.

Complete the table of ordered pairs for the equation \(y = x^2 − 2\).

To complete the table of ordered pairs for the equation \(y = x^2 − 2\), we substitute each \(x\)-value into the equation to obtain the corresponding \(y\)-value:

Substituting \(x = -3\) into the equation \(y = x^2 − 2\), we get \(y = (-3)^2 − 2 = 7\).
This is the point \((-3; 7)\).

Substituting \(x = -2\) into the equation \(y = x^2 − 2\), we get \(y = (-2)^2 − 2 = 2\).
This is the point \((-2; 2)\).

Substituting \(x = -1\) into the equation \(y = x^2 − 2\), we get \(y = (-1)^2 − 2 = -1\).
This is the point \((-1; -1)\).

Substituting \(x = 0\) into the equation \(y = x^2 − 2\), we get \(y = (0)^2 − 2 = -2\).
This is the point \((0; -2)\).

Substituting \(x = 1\) into the equation \(y = x^2 − 2\), we get \(y = (1)^2 − 2 = -1\).
This is the point \((1; -1)\).

Substituting \(x = 2\) into the equation \(y = x^2 − 2\), we get \(y = (2)^2 − 2 = 2\).
This is the point \((2; 2)\).

Substituting \(x = 3\) into the equation \(y = x^2 − 2\), we get \(y = (3)^2 − 2 = 7\).
This is the point \((3; 7)\).

\(x\) \(−3\) \(−2\) \(−1\) \(0\) \(1\) \(2\) \(3\)
\(y\) \(-7\) \(-2\) \(-1\) \(0\) \(-1\) \(2\) \(7\)

Plot the points on the Cartesian plane and draw the graph.

From the table of values, we obtain seven ordered pairs. We plot each point on the Cartesian plane and draw the graph by joining the points with a curve.
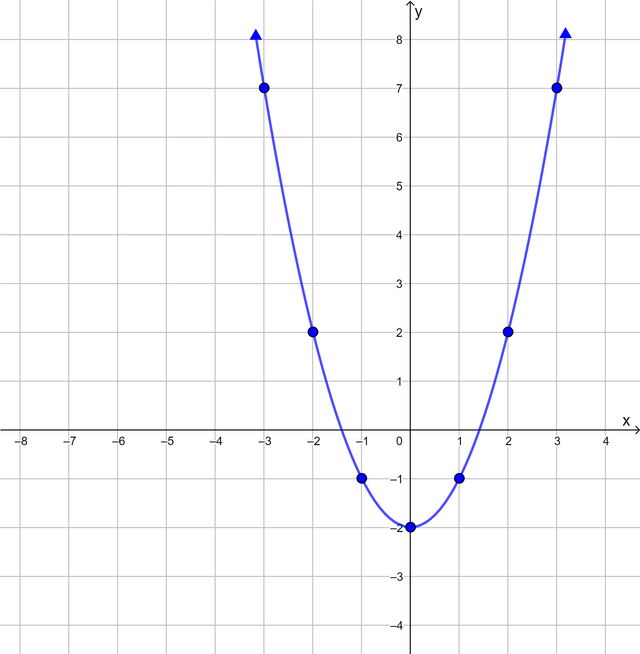
What do you notice about this graph? Here are some keywords to help you describe some of the features of the graph:

  • turning point
  • minimum
  • symmetry

Test yourself now

High marks in science are the key to your success and future plans. Test yourself and learn more on Siyavula Practice.

Sign up and test yourself
Exercise 23.3
\(x\) \(−3\) \(−2\) \(−1\) \(0\) \(1\) \(2\) \(3\)
\(y\)              
  1. Complete the table of values for the equation \(y = x + 3\).
  2. Plot the ordered pairs on the Cartesian plane.
  3. Draw the straight-line graph.
  4. Is the graph increasing or decreasing?
  5. Does the point \((5; 8)\) lie on the graph? Use a calculation in your answer.
  1. \(y = x + 3\).

    \(x\) \(−3\) \(−2\) \(−1\) \(0\) \(1\) \(2\) \(3\)
    \(y\) \(0\) \(1\) \(2\) \(3\) \(4\) \(5\) \(6\)
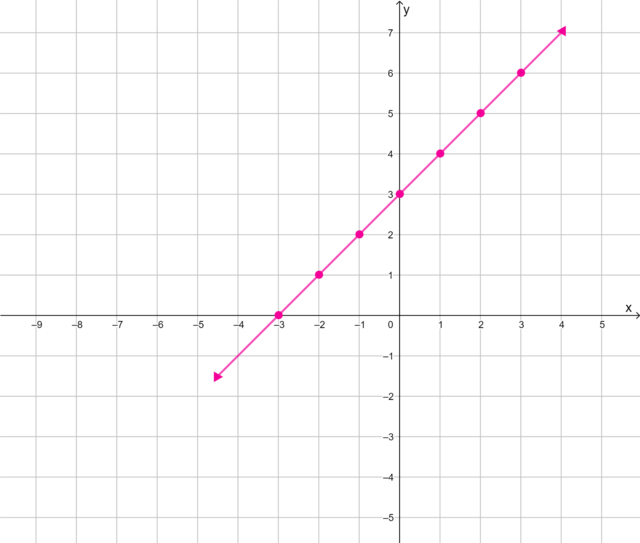
  2. and 3.
  3. Increasing
  4. For \(x = 5, y = x + 3 = 5 + 3 = 8\) Yes, the point \((5; 8)\) lies on the graph.
\(x\) \(−3\) \(−2\) \(−1\) \(0\) \(1\) \(2\) \(3\)
\(y\)              
  1. Complete the table of values for the equation \(y = x^2\).
  2. Plot the ordered pairs on the Cartesian plane.
  3. Draw the curve.
  4. Describe some of the features of the curve.
  5. Does the point \((-5; 10)\) lie on the curve? Use a calculation in your answer.
  1. \(y = x^2\).
\(x\) \(−3\) \(−2\) \(−1\) \(0\) \(1\) \(2\) \(3\)
\(y\) \(9\) \(4\) \(1\) \(0\) \(1\) \(4\) \(9\)
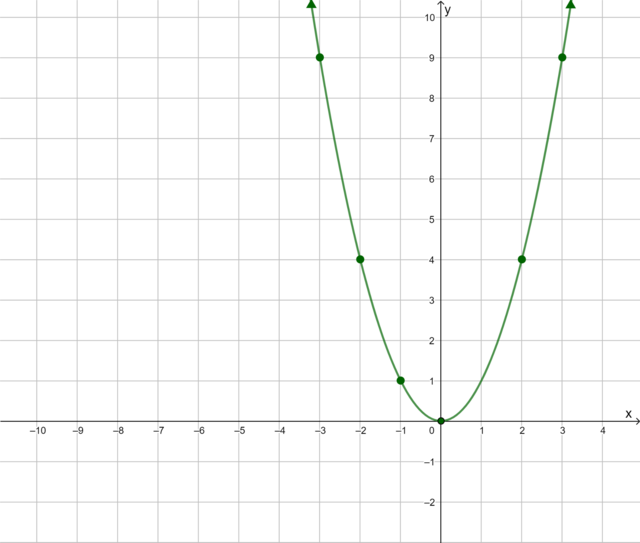
  1. and 3.
  2. Turning point at \((0; 0)\). Minimum point \((0; 0)\). Symmetrical about the \(y\)-axis.
  3. For \(x = -5, y = (-5)^2 = 25\)
  4. No, the point \((-5; 10)\) does not lie on the curve.
\(x\) \(−3\) \(−2\) \(−1\) \(0\) \(1\) \(2\) \(3\)
\(y\)              
  1. Complete the table of values for the equation \(y = -x + 2\).
  2. Plot the ordered pairs on the Cartesian plane.
  3. Draw the straight line graph.
  4. Is the graph increasing or decreasing?
  1. \[y = -x + 2\]
    \(x\) \(−3\) \(−2\) \(−1\) \(0\) \(1\) \(2\) \(3\)
    \(y\) \(5\) \(4\) \(3\) \(2\) \(1\) \(0\) \(-1\)
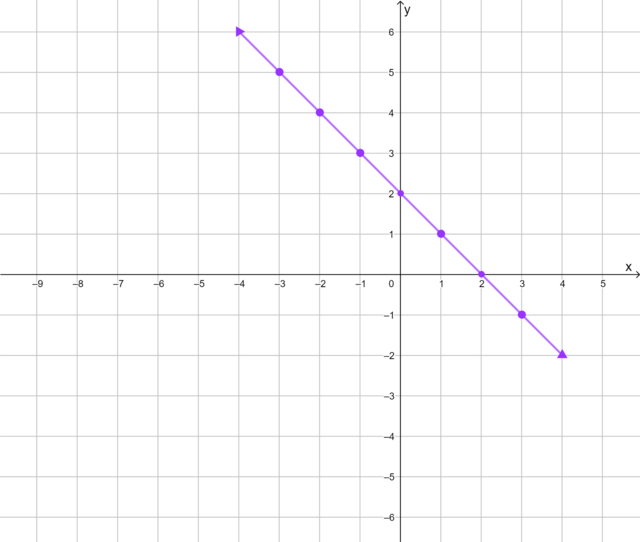
  2. and 3.
  3. Decreasing
\(x\) \(−3\) \(−2\) \(−1\) \(0\) \(1\) \(2\) \(3\)
\(y\)              
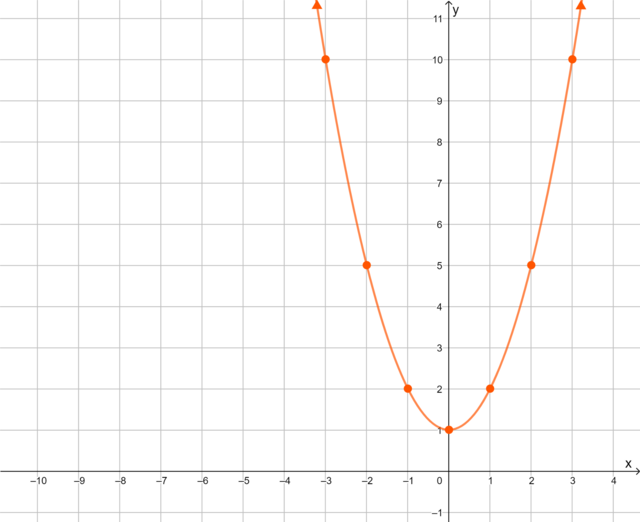
  1. Complete the table of values for the equation \(y = x^2 + 1\).
  2. Plot the ordered pairs on the Cartesian plane.
  3. Draw the curve.
  4. Describe some of the features of the curve.
  5. Does the point \((-4; 17)\) lie on the curve? Use a calculation in your answer.
  1. \[y = x^2 + 1\]
\(x\) \(−3\) \(−2\) \(−1\) \(0\) \(1\) \(2\) \(3\)
\(y\) \(10\) \(5\) \(2\) \(1\) \(2\) \(5\) \(10\)
  1. and 3.
  2. Turning point at \((0; 1)\). Minimum point \((0; 1)\). Symmetrical about the \(y\)-axis.
  3. For \(x = -4, y = x^2 + 1 = (-4)^2 + 1 = 16 + 1 = 17\)
    Yes, the point \((-4; 17)\) lies on the curve.
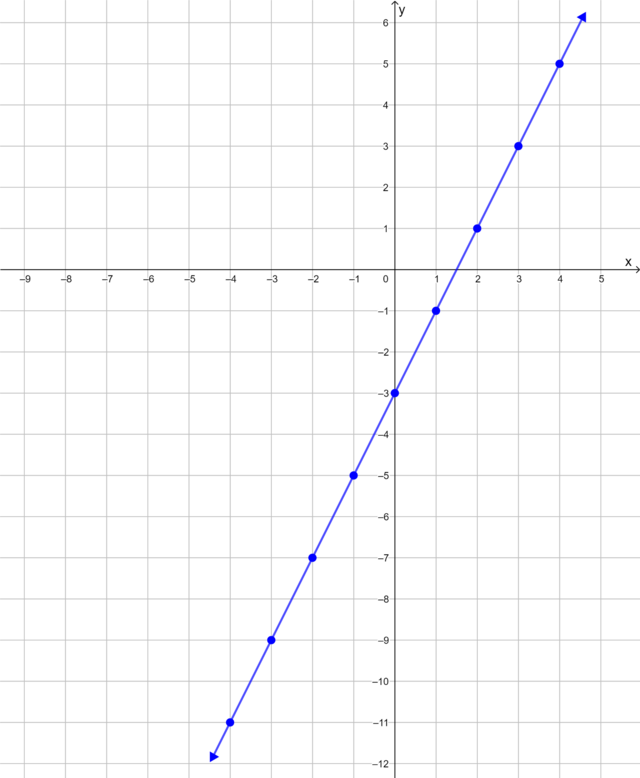
  1. Complete a table of values for the equation \(y = 2x − 3\).
  2. Plot the ordered pairs on the Cartesian plane and draw the graph.
  3. Use your graph to determine the value of \(x\) for the point \((x; -5)\).
  1. \[y = 2x − 3\]
\(x\) \(−4\) \(−3\) \(−2\) \(−1\) \(0\) \(1\) \(2\) \(3\) \(4\)
\(y\) \(−11\) \(−9\) \(−7)\ \(−5\) \(−3\) \(−1\) \(1\) \(3\) \(5\)
  1. \[(-1; -5)\]
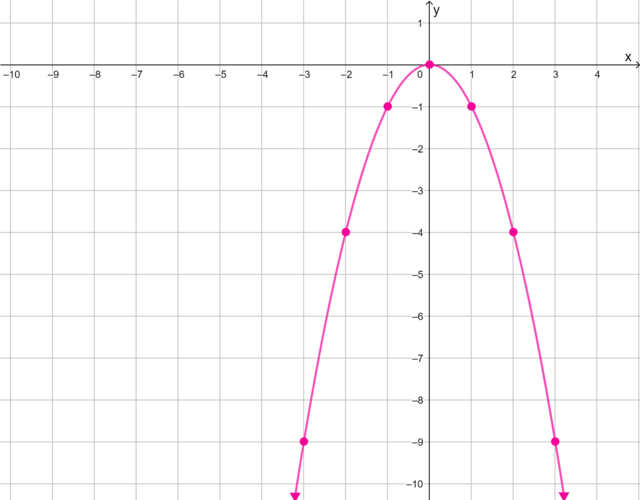
  1. Complete a table of values for the equation \(y = -x^2\).
  2. Plot the ordered pairs on the Cartesian plane and draw the curve.
  3. Describe some of the features of the curve.
  4. Compare this curve with the graph in Question 2. Describe what you notice about these two graphs.
  1. \[y = -x^2\]
\(x\) \(−3\) \(−2\) \(−1\) \(0\) \(1\) \(2\) \(3\)
\(y\) \(−9\) \(−4\) \(−1\) \(0\) \(-1\) \(-4\) \(-9\)
  1. Turning point at \((0; 0)\). Maximum point \((0; 0)\). Symmetrical about the \(y\)-axis.
  2. The two graphs are the same shape but extend in opposite directions.

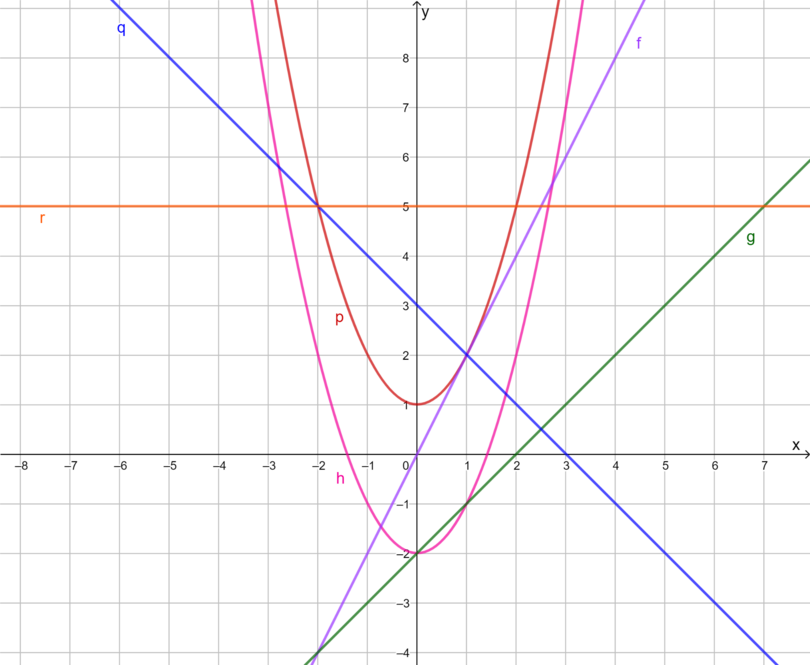
The diagram shows four line graphs and two curves. The line graphs \(f, g, q\) and \(r\) are shown. The non-linear curves \(h\) and \(p\) are shown.

Use the diagram to answer the questions.

  1. Name two graphs that are increasing.
  2. Name one graph that is constant.
  3. Which graph is decreasing?
  4. Name three graphs that pass through the point \((1; 2)\).
  5. Which graph passes through the origin?
  1. Graphs \(f\) and \(g\) are increasing.
  2. Graph \(r\) is constant.
  3. Graph \(q\) is decreasing.
  4. Graphs \(p, q\) and \(f\) pass through the point \((1; 2)\).
  5. Graph \(f\) passes through the origin.