Chapter 23: Graphs
23.1 Introduction
Graphs are a visual representation of information that make it easier for people to understand the data that is being shown. A graph can also make it easier to identify a pattern or a trend in the data.
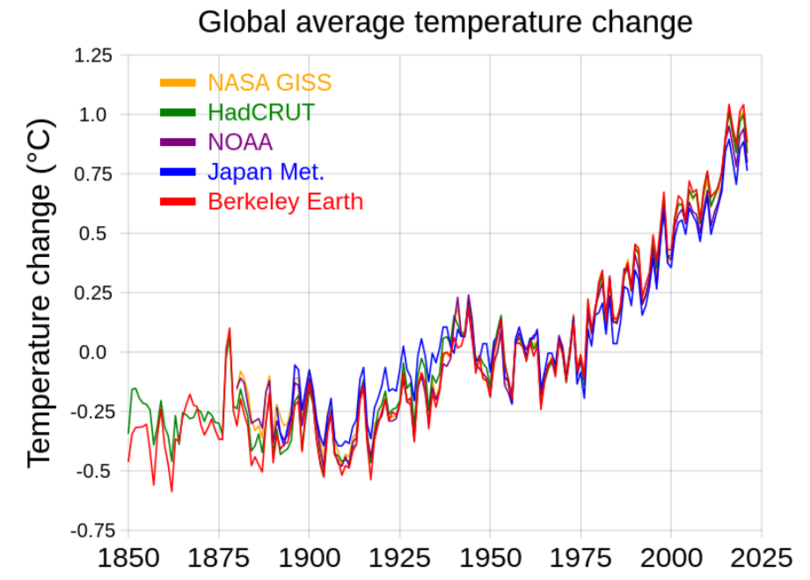
For example, a table of values of global average temperatures would not have the same impact as the graph below. The graph makes it very clear how global average temperatures have increased over the past 175 years.

RCraig09, CC BY-SA 4.0, via Wikimedia Commons
The graph shows temperature data from five different scientific organisations:
- NASA Goddard Institute for Space Studies (US)
- HadCRUT (Met Office Hadley Centre, UK)
- National Oceanic and Atmospheric Administration (US)
- Japan Meteorological Agency
- Berkeley Earth (US)
